
- Start >
- Rivers >
- Discharge >
- Isar >
- Rottersdorf >
- Chart of year

Chart of year Rottersdorf / Vils
Discharge from 27.01.2021 to 26.01.2022
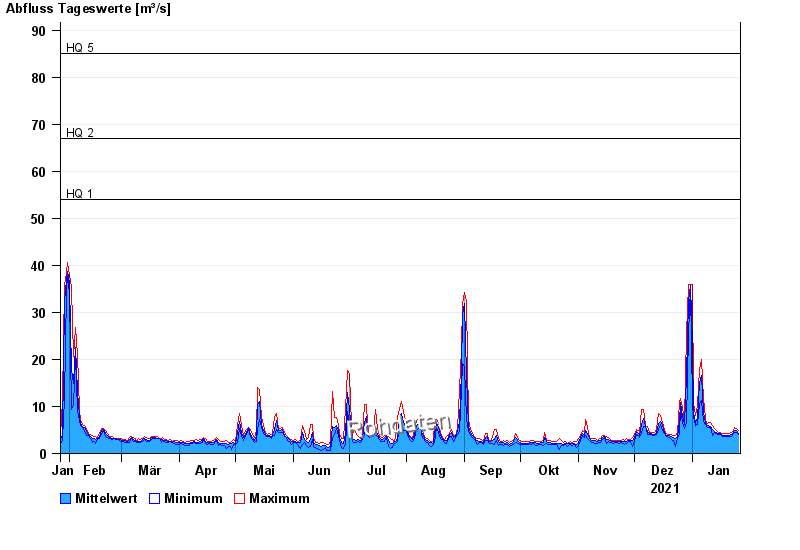
- HQ1 54 m³/s
- HQ2 67 m³/s
- HQ5 85 m³/s
- HQ10 98 m³/s
- HQ20 110 m³/s
| Date | Mean value [m³/s] | Maximum [m³/s] | Minimum [m³/s] |
|---|---|---|---|
| 26.01.2022 | 4.27 | 4.79 | 3.99 |
| 25.01.2022 | 4.81 | 5.24 | 4.37 |
| 24.01.2022 | 4.89 | 5.47 | 4.57 |
| 23.01.2022 | 4.38 | 4.79 | 4.18 |
| 22.01.2022 | 4.05 | 4.37 | 3.64 |
| 21.01.2022 | 3.85 | 4.18 | 3.64 |
| 20.01.2022 | 3.89 | 4.18 | 3.64 |
© Bayerisches Landesamt für Umwelt 2024