
- Start >
- Rivers >
- Discharge >
- Isar >
- Rottersdorf >
- Chart of year

Chart of year Rottersdorf / Vils
Discharge from 01.01.2024 to 25.04.2024
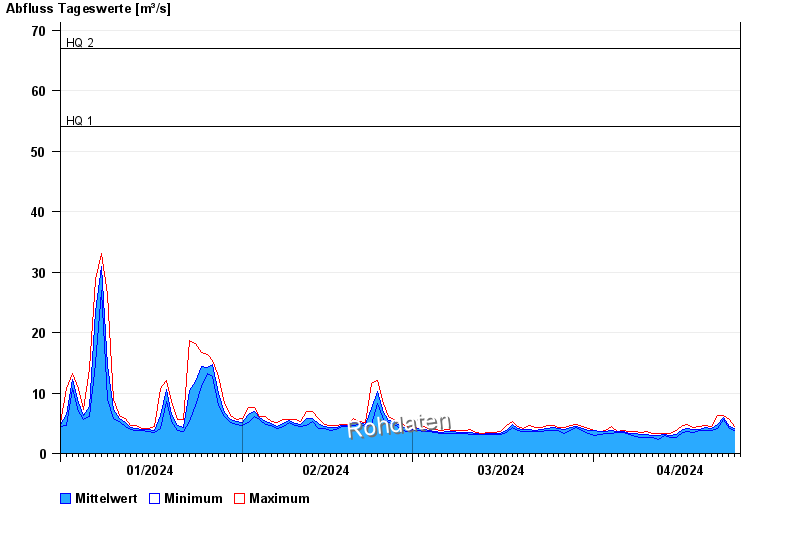
- HQ1 54 m³/s
- HQ2 67 m³/s
- HQ5 85 m³/s
- HQ10 98 m³/s
- HQ20 110 m³/s
| Date | Mean value [m³/s] | Maximum [m³/s] | Minimum [m³/s] |
|---|---|---|---|
| 25.04.2024 | 4.12 | 4.45 | 3.88 |
| 24.04.2024 | 4.47 | 5.57 | 4.06 |
| 23.04.2024 | 5.91 | 6.36 | 5.57 |
| 22.04.2024 | 4.8 | 6.36 | 4.06 |
| 21.04.2024 | 4.11 | 4.45 | 3.88 |
| 20.04.2024 | 4.22 | 4.65 | 3.88 |
| 19.04.2024 | 4.04 | 4.45 | 3.88 |
© Bayerisches Landesamt für Umwelt 2024