
- Start >
- Rivers >
- Discharge >
- Isar >
- Rosenheim o.d. Mangfallmündung >
- Chart of month

Chart of month Rosenheim o.d. Mangfallmündung / Inn
Discharge from 03.06.2020 to 02.07.2020
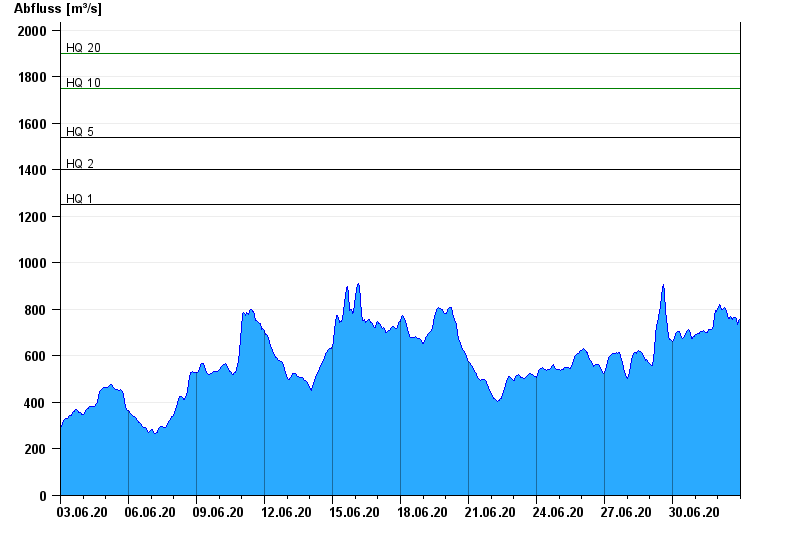
- HQ1 1250 m³/s
- HQ2 1400 m³/s
- HQ5 1540 m³/s
- HQ10 1750 m³/s
- HQ20 1900 m³/s
- HQ50 2150 m³/s
- HQ100 2300 m³/s
| Date | Runoff [m³/s] |
|---|---|
| 03.07.2020 00:45 | 790 |
| 03.07.2020 00:30 | 785 |
| 03.07.2020 00:15 | 775 |
| 03.07.2020 00:00 | 765 |
| 02.07.2020 23:45 | 760 |
| 02.07.2020 23:30 | 755 |
| 02.07.2020 23:15 | 755 |
© Bayerisches Landesamt für Umwelt 2024