
- Start >
- Rivers >
- Discharge >
- Isar >
- Rosenheim o.d. Mangfallmündung >
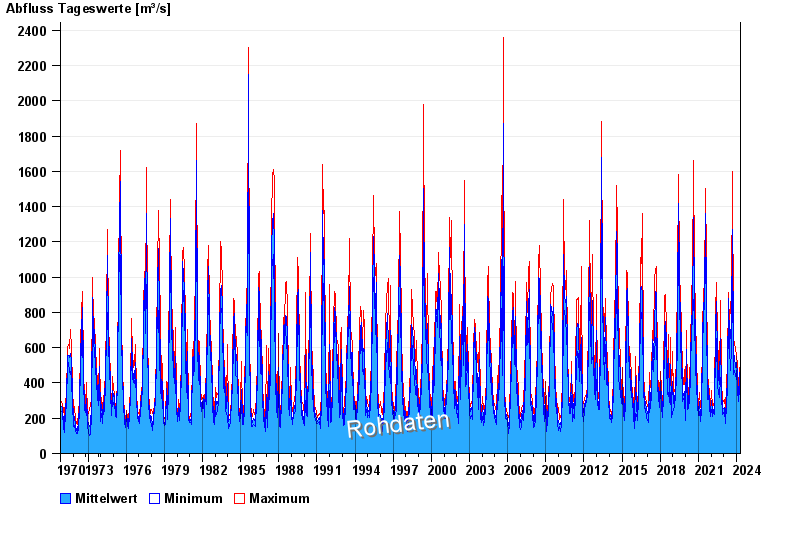
- Chart of total period

Chart of total period Rosenheim o.d. Mangfallmündung / Inn
Discharge from 01.11.1970 to 24.04.2024
| Date | Mean value [m³/s] | Maximum [m³/s] | Minimum [m³/s] |
|---|---|---|---|
| 24.04.2024 | 288 | 318 | 263 |
| 23.04.2024 | 307 | 342 | 287 |
| 22.04.2024 | 292 | 332 | 267 |
| 21.04.2024 | 294 | 332 | 260 |
| 20.04.2024 | 333 | 352 | 312 |
| 19.04.2024 | 339 | 375 | 315 |
| 18.04.2024 | 411 | 435 | 362 |
© Bayerisches Landesamt für Umwelt 2024