
- Start >
- Rivers >
- Discharge >
- Isar >
- Rißbachklamm >
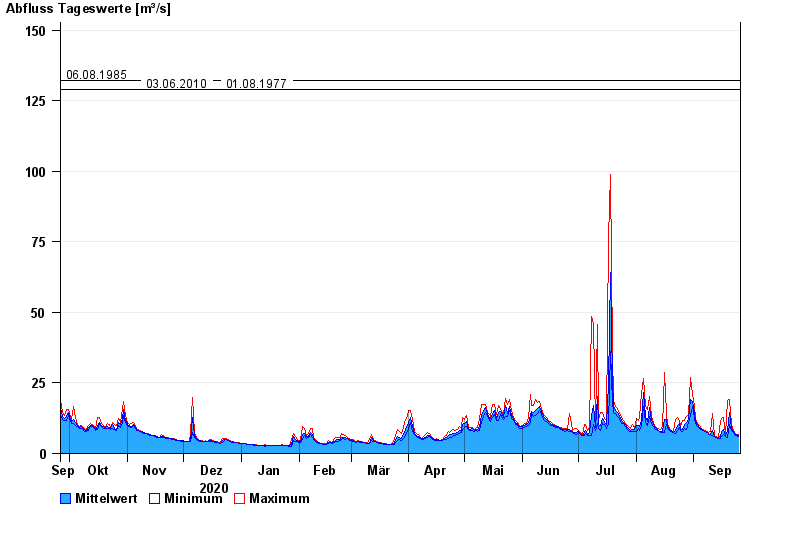
- Chart of year

Chart of year Rißbachklamm / Rißbach
Discharge from 26.09.2020 to 25.09.2021
- 23.08.2005 Abfluss: 208 m³/s
- 22.05.1999 Abfluss: 208 m³/s
- 06.08.1985 Abfluss: 132 m³/s
- 03.06.2010 Abfluss: 129 m³/s
- 01.08.1977 Abfluss: 129 m³/s
| Date | Mean value [m³/s] | Maximum [m³/s] | Minimum [m³/s] |
|---|---|---|---|
| 25.09.2021 | 6.35 | 6.64 | 6.17 |
| 24.09.2021 | 6.63 | 6.88 | 6.4 |
| 23.09.2021 | 7.04 | 7.38 | 6.64 |
| 22.09.2021 | 7.65 | 8.17 | 7.38 |
| 21.09.2021 | 8.94 | 10.2 | 8.17 |
| 20.09.2021 | 14.7 | 19.3 | 10.2 |
| 19.09.2021 | 8.04 | 18.9 | 5.73 |
© Bayerisches Landesamt für Umwelt 2024