
- Start >
- Rivers >
- Discharge >
- Isar >
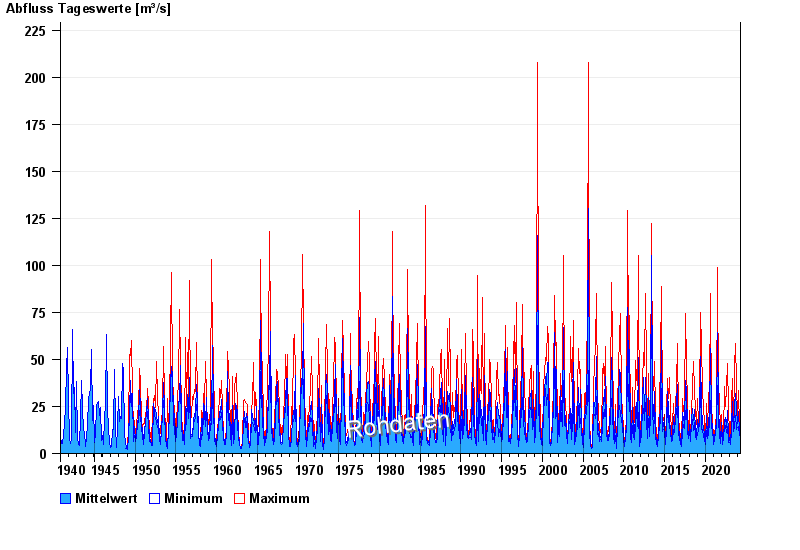
- Rißbachklamm >
- Chart of total period

Chart of total period Rißbachklamm / Rißbach
Discharge from 01.11.1940 to 25.04.2024
| Date | Mean value [m³/s] | Maximum [m³/s] | Minimum [m³/s] |
|---|---|---|---|
| 25.04.2024 | 6.83 | 6.83 | 6.83 |
| 24.04.2024 | 6.83 | 7.07 | 6.83 |
| 23.04.2024 | 7.2 | 7.32 | 7.07 |
| 22.04.2024 | 7.65 | 7.86 | 7.32 |
| 21.04.2024 | 7.97 | 8.38 | 7.86 |
| 20.04.2024 | 8.27 | 8.68 | 8.12 |
| 19.04.2024 | 7.97 | 8.38 | 7.6 |
© Bayerisches Landesamt für Umwelt 2024