
- Start >
- Rivers >
- Discharge >
- Isar >
- Rißbachklamm >
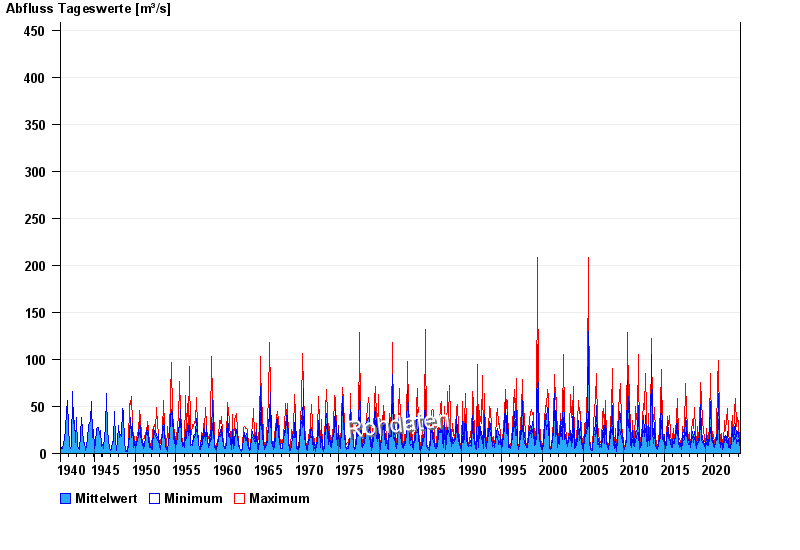
- Chart of total period

Chart of total period Rißbachklamm / Rißbach
Discharge from 01.11.1940 to 20.04.2024
 Für diesen Pegel sind keine Jährlichkeiten hinterlegt.
| Date | Mean value [m³/s] | Maximum [m³/s] | Minimum [m³/s] |
|---|---|---|---|
| 20.04.2024 | 8.42 | 8.68 | 8.38 |
| 19.04.2024 | 7.97 | 8.38 | 7.6 |
| 18.04.2024 | 8.1 | 8.12 | 7.86 |
| 17.04.2024 | 8.49 | 8.68 | 8.12 |
| 16.04.2024 | 9.38 | 10.4 | 8.38 |
| 15.04.2024 | 9.68 | 10.4 | 9.22 |
| 14.04.2024 | 9.31 | 10.4 | 8.68 |
© Bayerisches Landesamt für Umwelt 2024