

Chart of year Raisting / Rott
Discharge from 01.01.2018 to 31.12.2018
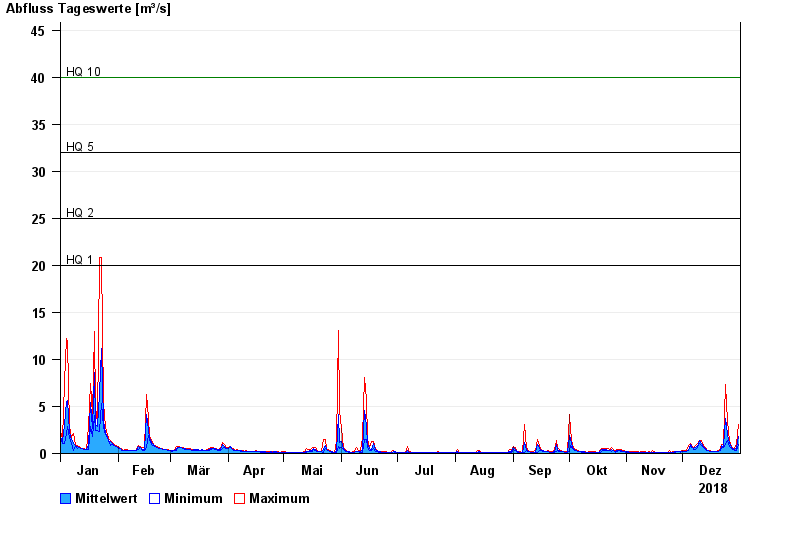
- HQ1 20 m³/s
- HQ2 25 m³/s
- HQ5 32 m³/s
- HQ10 40 m³/s
- HQ20 47 m³/s
- HQ50 57 m³/s
- HQ100 65 m³/s
| Date | Mean value [m³/s] | Maximum [m³/s] | Minimum [m³/s] |
|---|---|---|---|
| 31.12.2018 | 1.86 | 3.06 | 0.964 |
| 30.12.2018 | 0.525 | 0.964 | 0.343 |
| 29.12.2018 | 0.397 | 0.561 | 0.343 |
| 28.12.2018 | 0.48 | 0.561 | 0.423 |
| 27.12.2018 | 0.657 | 0.779 | 0.561 |
| 26.12.2018 | 1.03 | 1.36 | 0.779 |
| 25.12.2018 | 1.98 | 3.37 | 1.36 |
© Bayerisches Landesamt für Umwelt 2024