

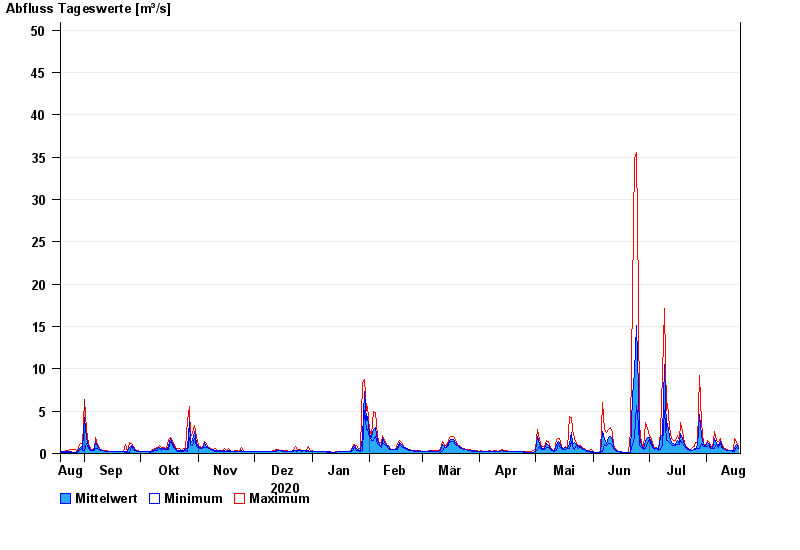
Chart of year Raisting / Rott
Discharge from 19.08.2020 to 18.08.2021
- 21.05.1999 Abfluss: 84,1 m³/s
- 18.06.1986 Abfluss: 77,7 m³/s
- 01.09.2002 Abfluss: 71 m³/s
- 29.05.2007 Abfluss: 51,5 m³/s
- 06.08.2000 Abfluss: 50,2 m³/s
| Date | Mean value [m³/s] | Maximum [m³/s] | Minimum [m³/s] |
|---|---|---|---|
| 18.08.2021 | 0.763 | 0.85 | 0.625 |
| 17.08.2021 | 1.03 | 1.44 | 0.734 |
| 16.08.2021 | 0.595 | 1.74 | 0.285 |
| 15.08.2021 | 0.316 | 0.318 | 0.284 |
| 14.08.2021 | 0.318 | 0.318 | 0.318 |
| 13.08.2021 | 0.354 | 0.354 | 0.318 |
| 12.08.2021 | 0.411 | 0.434 | 0.354 |
© Bayerisches Landesamt für Umwelt 2024