

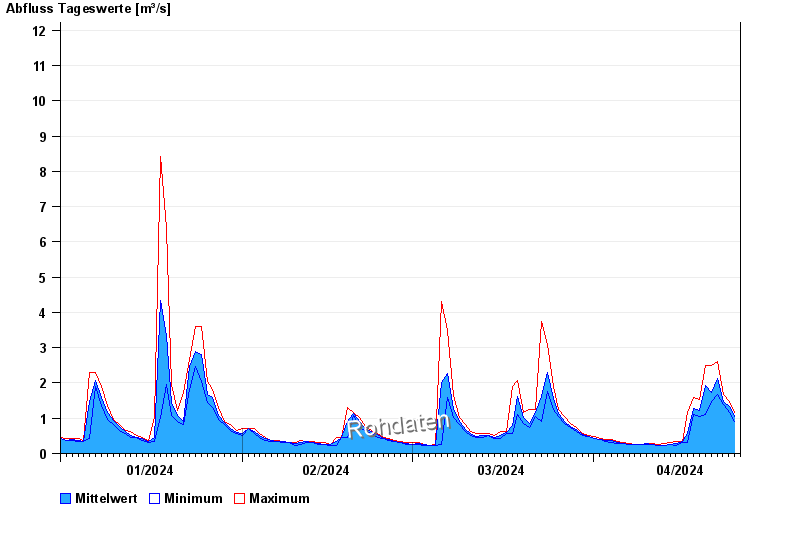
Chart of year Raisting / Rott
Discharge from 01.01.2024 to 25.04.2024
- 21.05.1999 Abfluss: 84,1 m³/s
- 18.06.1986 Abfluss: 77,7 m³/s
- 01.09.2002 Abfluss: 71 m³/s
- 29.05.2007 Abfluss: 51,5 m³/s
- 06.08.2000 Abfluss: 50,2 m³/s
| Date | Mean value [m³/s] | Maximum [m³/s] | Minimum [m³/s] |
|---|---|---|---|
| 25.04.2024 | 1.09 | 1.17 | 1.04 |
| 24.04.2024 | 1.34 | 1.46 | 1.17 |
| 23.04.2024 | 1.48 | 1.67 | 1.38 |
| 22.04.2024 | 2.13 | 2.6 | 1.67 |
| 21.04.2024 | 1.72 | 2.5 | 1.46 |
| 20.04.2024 | 1.94 | 2.5 | 1.11 |
| 19.04.2024 | 1.23 | 1.52 | 1.04 |
© Bayerisches Landesamt für Umwelt 2024