

Chart of year Raisting / Rott
Discharge from 23.10.2019 to 22.10.2020
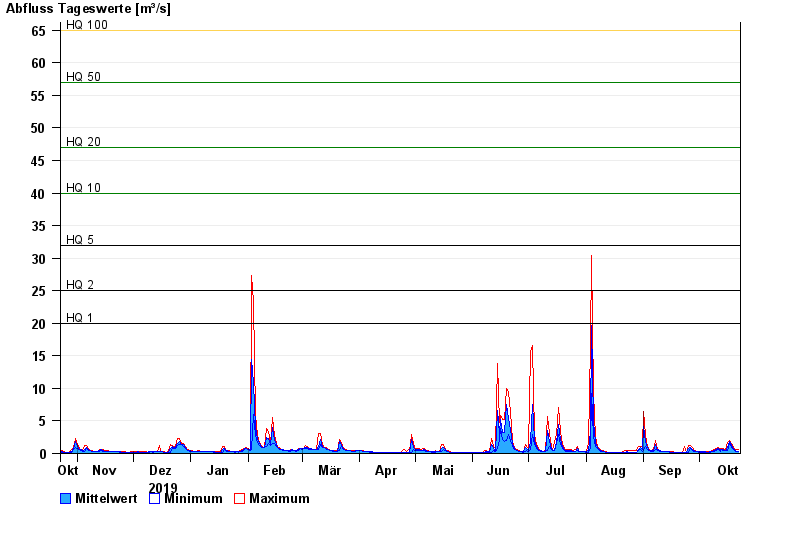
- HQ1 20 m³/s
- HQ2 25 m³/s
- HQ5 32 m³/s
- HQ10 40 m³/s
- HQ20 47 m³/s
- HQ50 57 m³/s
- HQ100 65 m³/s
| Date | Mean value [m³/s] | Maximum [m³/s] | Minimum [m³/s] |
|---|---|---|---|
| 22.10.2020 | 0.381 | 0.539 | 0.293 |
| 21.10.2020 | 0.368 | 0.588 | 0.261 |
| 20.10.2020 | 0.475 | 0.589 | 0.365 |
| 19.10.2020 | 0.712 | 0.994 | 0.589 |
| 18.10.2020 | 1.22 | 1.47 | 0.994 |
| 17.10.2020 | 1.78 | 1.92 | 1.47 |
| 16.10.2020 | 0.849 | 1.69 | 0.492 |
© Bayerisches Landesamt für Umwelt 2024