

Chart of year Raisting / Rott
Discharge from 15.12.2019 to 14.12.2020
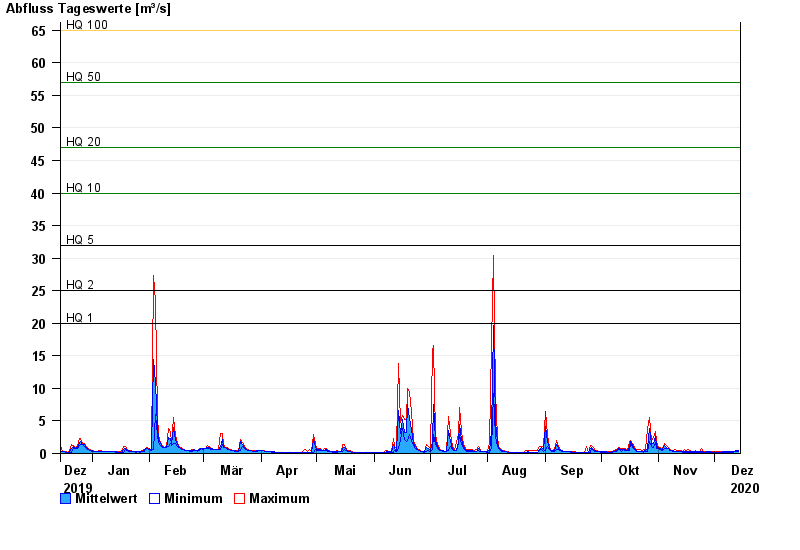
- HQ1 20 m³/s
- HQ2 25 m³/s
- HQ5 32 m³/s
- HQ10 40 m³/s
- HQ20 47 m³/s
- HQ50 57 m³/s
- HQ100 65 m³/s
| Date | Mean value [m³/s] | Maximum [m³/s] | Minimum [m³/s] |
|---|---|---|---|
| 14.12.2020 | 0.398 | 0.44 | 0.359 |
| 13.12.2020 | 0.388 | 0.44 | 0.288 |
| 12.12.2020 | 0.28 | 0.322 | 0.257 |
| 11.12.2020 | 0.27 | 0.323 | 0.228 |
| 10.12.2020 | 0.263 | 0.289 | 0.228 |
| 09.12.2020 | 0.253 | 0.289 | 0.228 |
| 08.12.2020 | 0.256 | 0.289 | 0.228 |
© Bayerisches Landesamt für Umwelt 2024