

Chart of total period Raisting / Rott
Discharge from 01.11.1950 to 18.04.2024
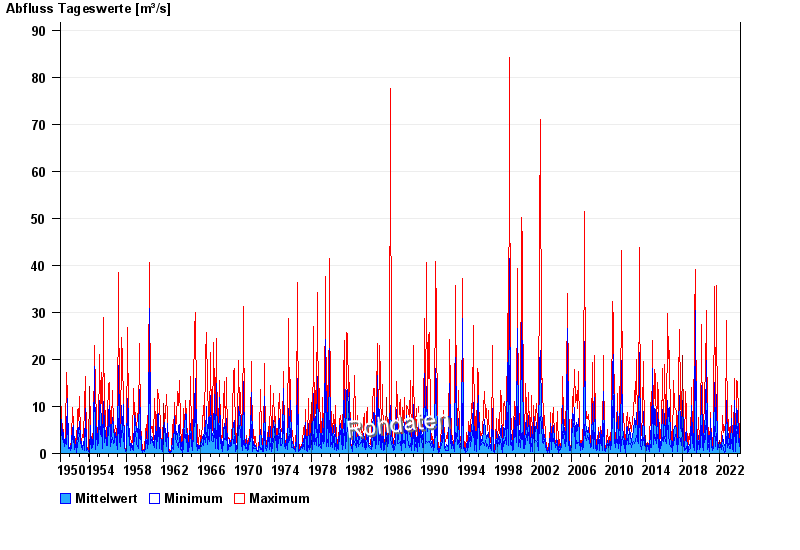
| Date | Mean value [m³/s] | Maximum [m³/s] | Minimum [m³/s] |
|---|---|---|---|
| 18.04.2024 | 1.27 | 1.6 | 1.11 |
| 17.04.2024 | 0.581 | 1.17 | 0.312 |
| 16.04.2024 | 0.331 | 0.348 | 0.312 |
| 15.04.2024 | 0.273 | 0.348 | 0.218 |
| 14.04.2024 | 0.267 | 0.312 | 0.247 |
| 13.04.2024 | 0.239 | 0.278 | 0.218 |
| 12.04.2024 | 0.235 | 0.247 | 0.218 |
© Bayerisches Landesamt für Umwelt 2024