

Chart of total period Prien / Prien
Discharge from 01.11.1950 to 23.04.2024
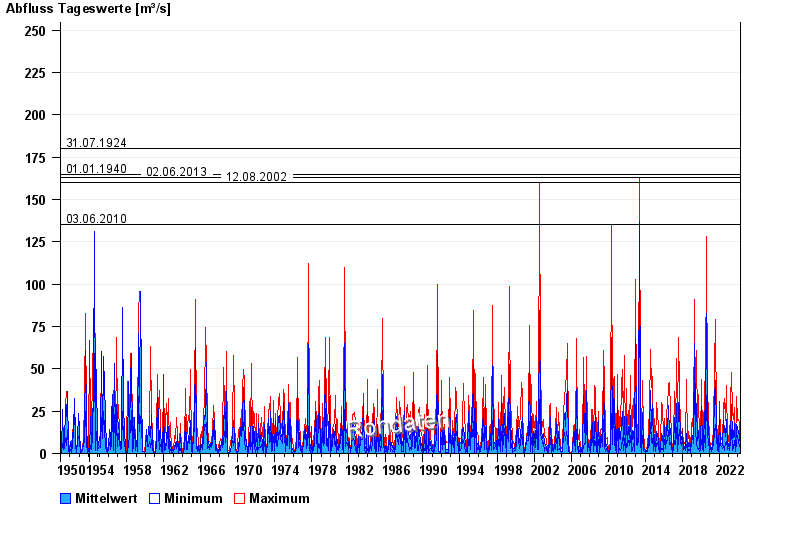
- 31.07.1924 Abfluss: 180 m³/s
- 01.01.1940 Abfluss: 165 m³/s
- 02.06.2013 Abfluss: 163 m³/s
- 12.08.2002 Abfluss: 160 m³/s
- 03.06.2010 Abfluss: 135 m³/s
| Date | Mean value [m³/s] | Maximum [m³/s] | Minimum [m³/s] |
|---|---|---|---|
| 23.04.2024 | 1.68 | 1.91 | 1.44 |
| 22.04.2024 | 2.25 | 3.8 | 1.62 |
| 21.04.2024 | 2.43 | 2.95 | 2.11 |
| 20.04.2024 | 2.07 | 2.45 | 1.05 |
| 19.04.2024 | 0.867 | 1.12 | 0.663 |
| 18.04.2024 | 0.745 | 1.62 | 0.408 |
| 17.04.2024 | 0.663 | 0.663 | 0.663 |
© Bayerisches Landesamt für Umwelt 2024