

Chart of total period Prien / Prien
Discharge from 01.11.1950 to 19.04.2024
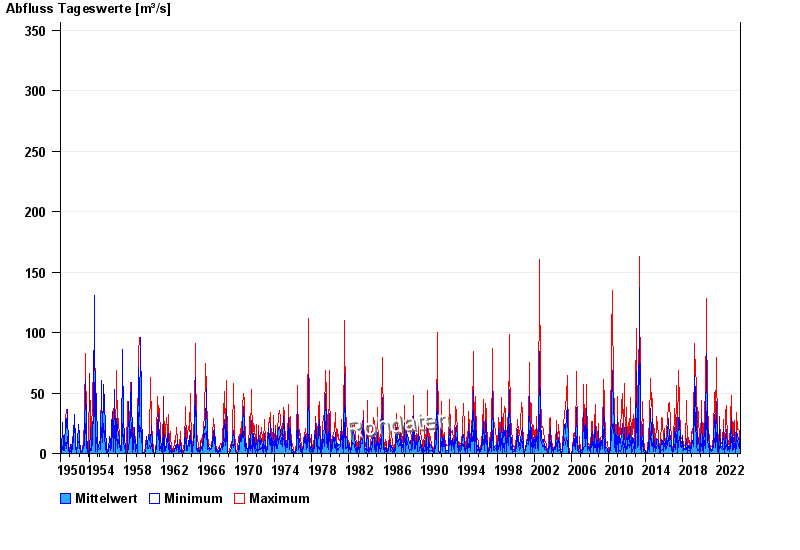 Für diesen Pegel sind keine Jährlichkeiten hinterlegt.
| Date | Mean value [m³/s] | Maximum [m³/s] | Minimum [m³/s] |
|---|---|---|---|
| 19.04.2024 | 1.06 | 1.12 | 0.978 |
| 18.04.2024 | 0.745 | 1.62 | 0.408 |
| 17.04.2024 | 0.663 | 0.663 | 0.663 |
| 16.04.2024 | 0.663 | 0.663 | 0.663 |
| 15.04.2024 | 0.663 | 0.843 | 0.408 |
| 14.04.2024 | 0.664 | 0.722 | 0.663 |
| 13.04.2024 | 0.664 | 0.722 | 0.663 |
© Bayerisches Landesamt für Umwelt 2024