

Chart of year Percha / Lüßbach
Discharge from 30.09.2020 to 29.09.2021
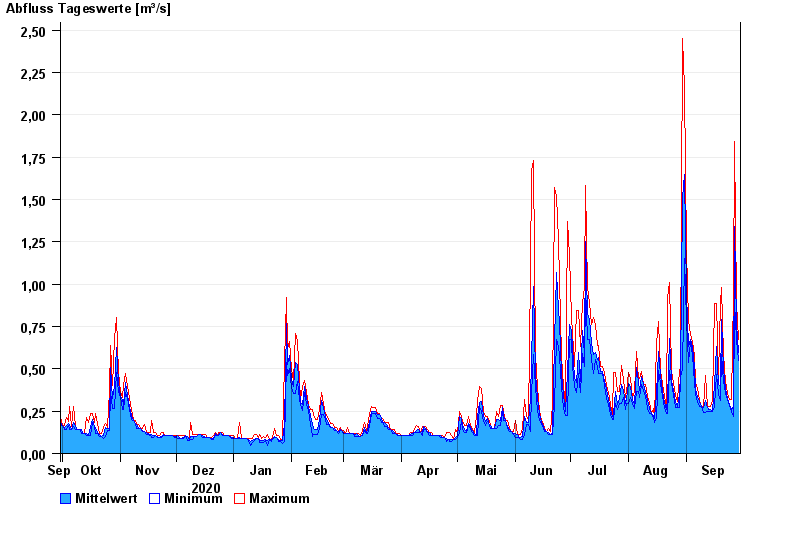
| Date | Mean value [m³/s] | Maximum [m³/s] | Minimum [m³/s] |
|---|---|---|---|
| 29.09.2021 | 0.595 | 0.673 | 0.548 |
| 28.09.2021 | 0.768 | 0.892 | 0.673 |
| 27.09.2021 | 1.34 | 1.84 | 0.892 |
| 26.09.2021 | 0.28 | 0.936 | 0.221 |
| 25.09.2021 | 0.259 | 0.318 | 0.25 |
| 24.09.2021 | 0.287 | 0.317 | 0.283 |
| 23.09.2021 | 0.326 | 0.353 | 0.317 |
© Bayerisches Landesamt für Umwelt 2024