

Chart of year Percha / Lüßbach
Discharge from 28.07.2022 to 27.07.2023
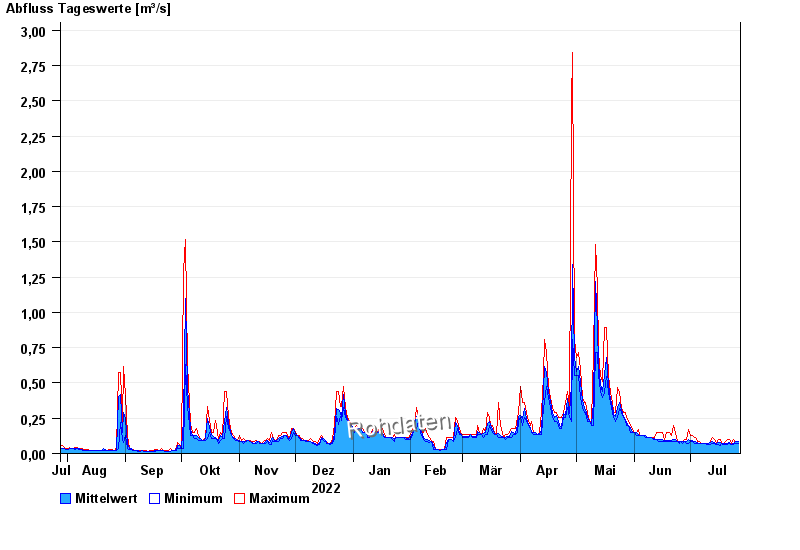
| Date | Mean value [m³/s] | Maximum [m³/s] | Minimum [m³/s] |
|---|---|---|---|
| 27.07.2023 | 0.084 | 0.085 | 0.074 |
| 26.07.2023 | 0.083 | 0.085 | 0.074 |
| 25.07.2023 | 0.078 | 0.085 | 0.074 |
| 24.07.2023 | 0.072 | 0.098 | 0.064 |
| 23.07.2023 | 0.065 | 0.074 | 0.064 |
| 22.07.2023 | 0.077 | 0.098 | 0.074 |
| 21.07.2023 | 0.073 | 0.098 | 0.064 |
© Bayerisches Landesamt für Umwelt 2024