

Chart of year Percha / Lüßbach
Discharge from 28.07.2019 to 27.07.2020
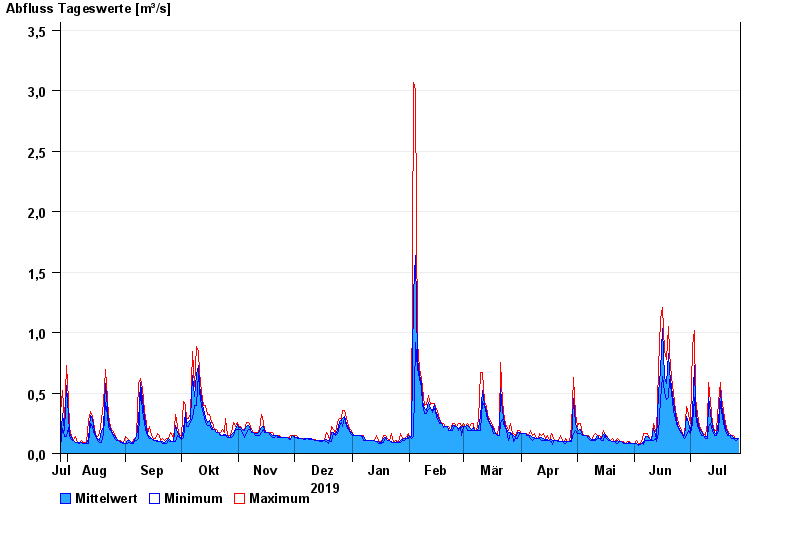
| Date | Mean value [m³/s] | Maximum [m³/s] | Minimum [m³/s] |
|---|---|---|---|
| 27.07.2020 | 0.128 | 0.128 | 0.128 |
| 26.07.2020 | 0.124 | 0.128 | 0.111 |
| 25.07.2020 | 0.128 | 0.128 | 0.111 |
| 24.07.2020 | 0.129 | 0.147 | 0.128 |
| 23.07.2020 | 0.147 | 0.147 | 0.128 |
| 22.07.2020 | 0.148 | 0.169 | 0.147 |
| 21.07.2020 | 0.173 | 0.194 | 0.147 |
© Bayerisches Landesamt für Umwelt 2024