

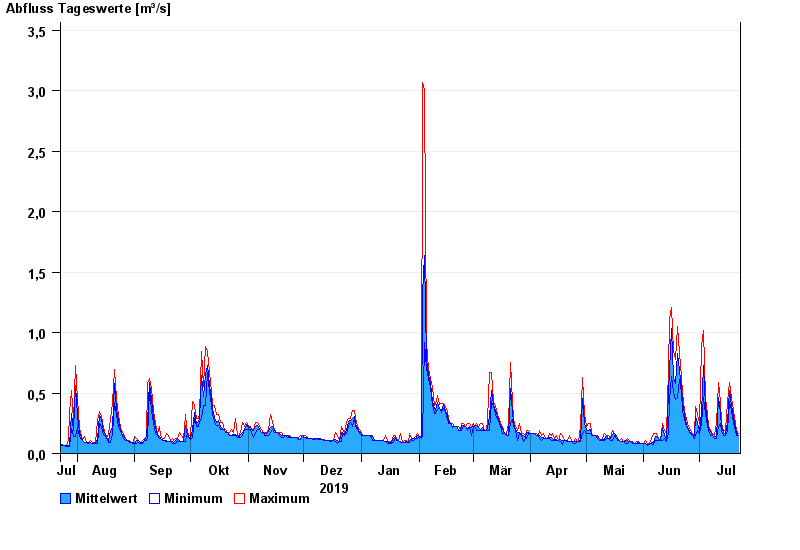
Chart of year Percha / Lüßbach
Discharge from 23.07.2019 to 22.07.2020
| Date | Mean value [m³/s] | Maximum [m³/s] | Minimum [m³/s] |
|---|---|---|---|
| 22.07.2020 | 0.148 | 0.169 | 0.147 |
| 21.07.2020 | 0.173 | 0.194 | 0.147 |
| 20.07.2020 | 0.219 | 0.252 | 0.194 |
| 19.07.2020 | 0.3 | 0.355 | 0.252 |
| 18.07.2020 | 0.401 | 0.467 | 0.355 |
| 17.07.2020 | 0.521 | 0.586 | 0.429 |
| 16.07.2020 | 0.263 | 0.429 | 0.194 |
© Bayerisches Landesamt für Umwelt 2024