

Chart of year Percha / Lüßbach
Discharge from 17.09.2019 to 16.09.2020
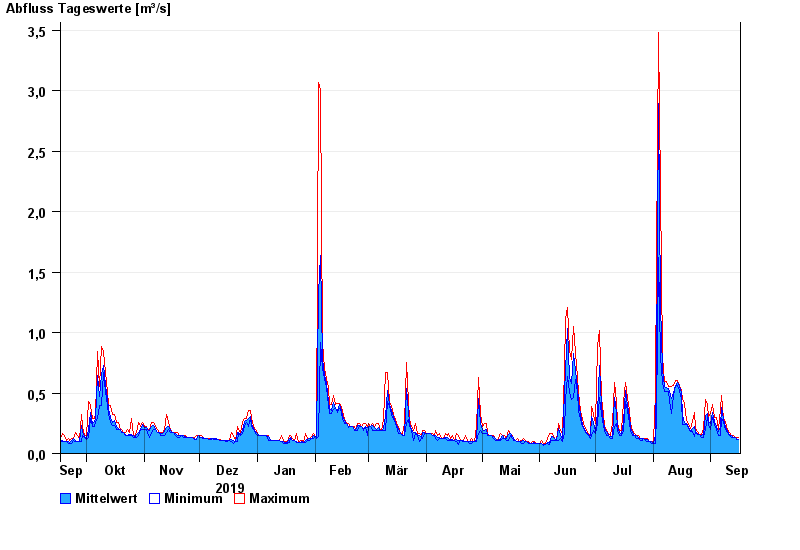
| Date | Mean value [m³/s] | Maximum [m³/s] | Minimum [m³/s] |
|---|---|---|---|
| 16.09.2020 | 0.113 | 0.129 | 0.112 |
| 15.09.2020 | 0.128 | 0.13 | 0.112 |
| 14.09.2020 | 0.13 | 0.13 | 0.13 |
| 13.09.2020 | 0.131 | 0.15 | 0.13 |
| 12.09.2020 | 0.147 | 0.15 | 0.13 |
| 11.09.2020 | 0.151 | 0.173 | 0.15 |
| 10.09.2020 | 0.178 | 0.198 | 0.173 |
© Bayerisches Landesamt für Umwelt 2024