

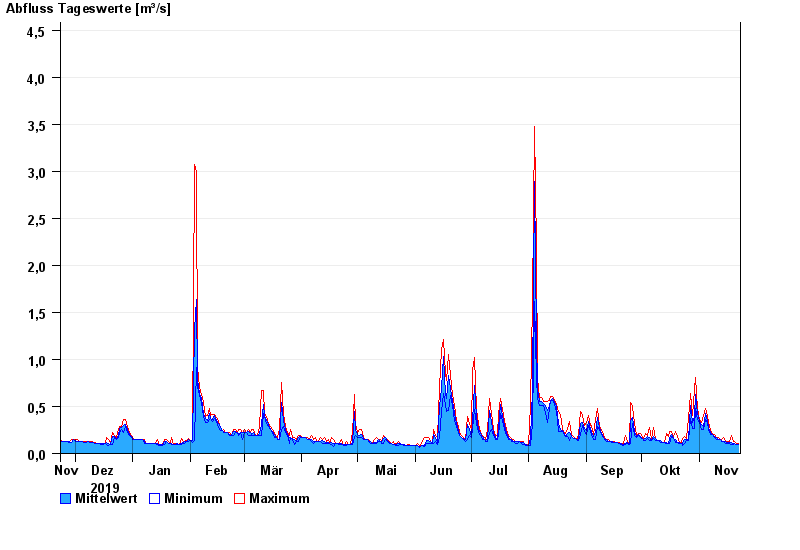
Chart of year Percha / Lüßbach
Discharge from 23.11.2019 to 22.11.2020
- 18.06.1979 Abfluss: 12,5 m³/s
- 19.07.1999 Abfluss: 8,92 m³/s
- 23.08.2005 Abfluss: 6,43 m³/s
- 22.05.1999 Abfluss: 6,26 m³/s
- 29.05.2007 Abfluss: 6,05 m³/s
| Date | Mean value [m³/s] | Maximum [m³/s] | Minimum [m³/s] |
|---|---|---|---|
| 22.11.2020 | 0.096 | 0.108 | 0.094 |
| 21.11.2020 | 0.099 | 0.108 | 0.094 |
| 20.11.2020 | 0.109 | 0.125 | 0.108 |
| 19.11.2020 | 0.106 | 0.125 | 0.095 |
| 18.11.2020 | 0.113 | 0.192 | 0.095 |
| 17.11.2020 | 0.114 | 0.126 | 0.109 |
| 16.11.2020 | 0.121 | 0.126 | 0.11 |
© Bayerisches Landesamt für Umwelt 2024