

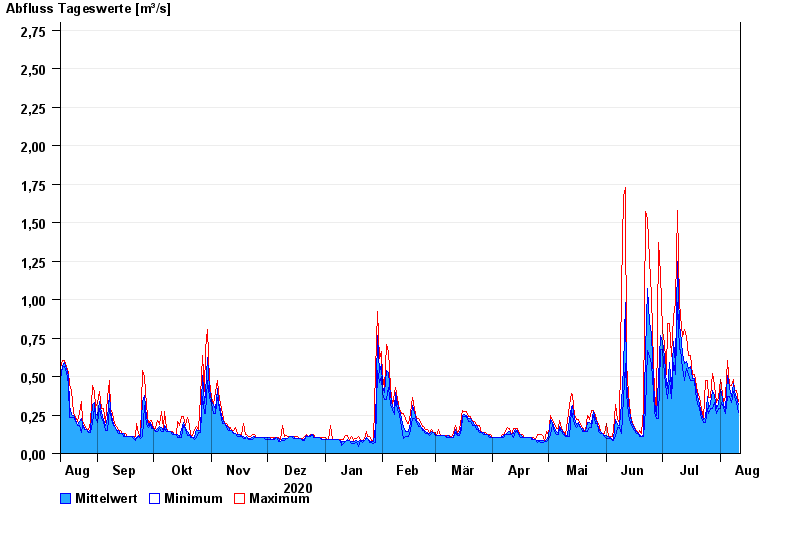
Chart of year Percha / Lüßbach
Discharge from 12.08.2020 to 11.08.2021
- 18.06.1979 Abfluss: 12,5 m³/s
- 19.07.1999 Abfluss: 8,92 m³/s
- 23.08.2005 Abfluss: 6,43 m³/s
- 22.05.1999 Abfluss: 6,26 m³/s
- 29.05.2007 Abfluss: 6,05 m³/s
| Date | Mean value [m³/s] | Maximum [m³/s] | Minimum [m³/s] |
|---|---|---|---|
| 11.08.2021 | 0.32 | 0.335 | 0.266 |
| 10.08.2021 | 0.361 | 0.407 | 0.334 |
| 09.08.2021 | 0.406 | 0.407 | 0.37 |
| 08.08.2021 | 0.454 | 0.483 | 0.406 |
| 07.08.2021 | 0.373 | 0.444 | 0.333 |
| 06.08.2021 | 0.427 | 0.444 | 0.369 |
| 05.08.2021 | 0.507 | 0.602 | 0.368 |
© Bayerisches Landesamt für Umwelt 2024