

Chart of year Panzing / Bina
Discharge from 01.01.2024 to 19.04.2024
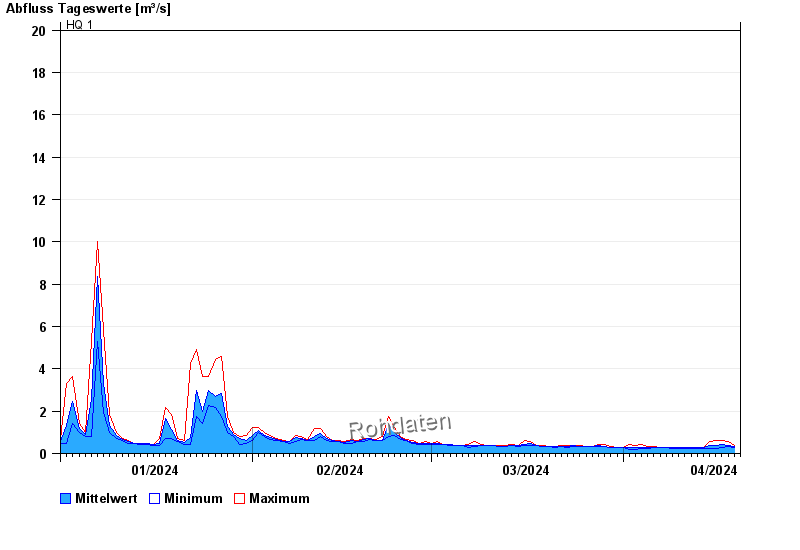
- HQ1 20 m³/s
- HQ2 28 m³/s
- HQ5 38 m³/s
- HQ10 46 m³/s
- HQ20 53 m³/s
- HQ50 64 m³/s
- HQ100 72 m³/s
| Date | Mean value [m³/s] | Maximum [m³/s] | Minimum [m³/s] |
|---|---|---|---|
| 19.04.2024 | 0.314 | 0.33 | 0.291 |
| 18.04.2024 | 0.392 | 0.567 | 0.33 |
| 17.04.2024 | 0.423 | 0.625 | 0.291 |
| 16.04.2024 | 0.361 | 0.625 | 0.256 |
| 15.04.2024 | 0.396 | 0.567 | 0.256 |
| 14.04.2024 | 0.288 | 0.291 | 0.256 |
| 13.04.2024 | 0.287 | 0.291 | 0.256 |
© Bayerisches Landesamt für Umwelt 2024