

Chart of year Operding / Hammerbach
Discharge from 01.01.2021 to 31.12.2021
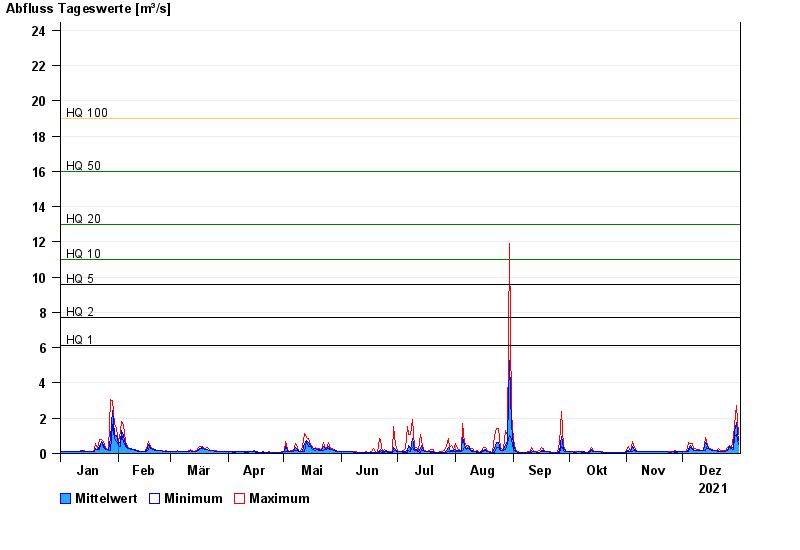
- HQ1 6,1 m³/s
- HQ2 7,7 m³/s
- HQ5 9,6 m³/s
- HQ10 11 m³/s
- HQ20 13 m³/s
- HQ50 16 m³/s
- HQ100 19 m³/s
| Date | Mean value [m³/s] | Maximum [m³/s] | Minimum [m³/s] |
|---|---|---|---|
| 31.12.2021 | 0.728 | 1.08 | 0.49 |
| 30.12.2021 | 1.78 | 2.72 | 1.08 |
| 29.12.2021 | 1.23 | 1.58 | 0.95 |
| 28.12.2021 | 0.345 | 0.95 | 0.246 |
| 27.12.2021 | 0.312 | 0.361 | 0.259 |
| 26.12.2021 | 0.393 | 0.444 | 0.361 |
| 25.12.2021 | 0.254 | 0.361 | 0.175 |
© Bayerisches Landesamt für Umwelt 2024