
- Start >
- Rivers >
- Discharge >
- Isar >
- Odelzhausen >
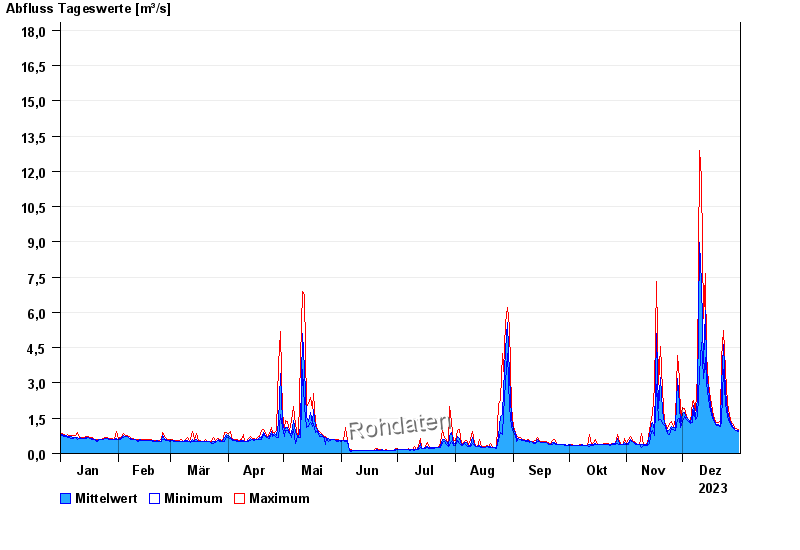
- Chart of year

Chart of year Odelzhausen / Glonn
Discharge from 01.01.2023 to 31.12.2023
- Abfluss: m³/s
- Abfluss: m³/s
- Abfluss: m³/s
- Abfluss: m³/s
- Abfluss: m³/s
| Date | Mean value [m³/s] | Maximum [m³/s] | Minimum [m³/s] |
|---|---|---|---|
| 31.12.2023 | 0.958 | 1.01 | 0.93 |
| 30.12.2023 | 0.994 | 1.05 | 0.968 |
| 29.12.2023 | 1.04 | 1.09 | 1.01 |
| 28.12.2023 | 1.11 | 1.23 | 1.05 |
| 27.12.2023 | 1.23 | 1.32 | 1.14 |
| 26.12.2023 | 1.43 | 1.6 | 1.32 |
| 25.12.2023 | 1.81 | 2.13 | 1.56 |
© Bayerisches Landesamt für Umwelt 2024