

Chart of year Obernach / Ach
Discharge from 01.01.2024 to 18.04.2024
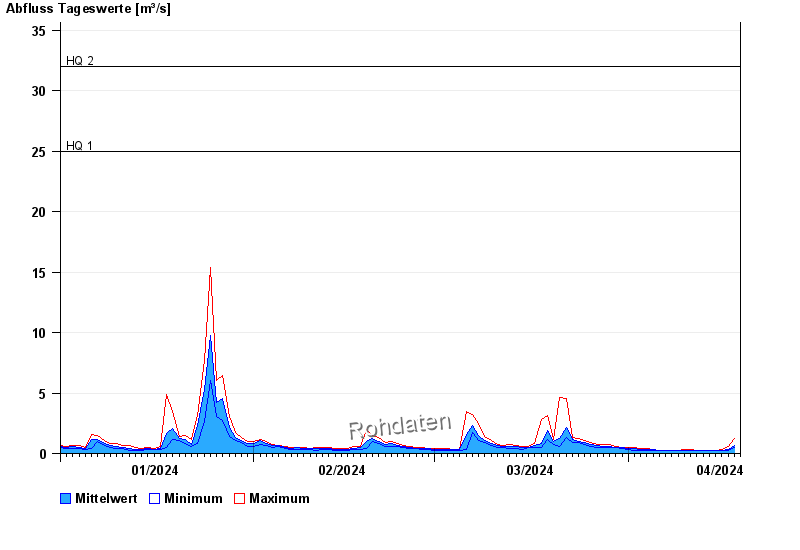
- HQ1 25 m³/s
- HQ2 32 m³/s
- HQ5 38 m³/s
- HQ10 45 m³/s
- HQ20 52 m³/s
- HQ50 63 m³/s
- HQ100 70 m³/s
| Date | Mean value [m³/s] | Maximum [m³/s] | Minimum [m³/s] |
|---|---|---|---|
| 18.04.2024 | 0.595 | 0.665 | 0.514 |
| 17.04.2024 | 0.329 | 0.612 | 0.251 |
| 16.04.2024 | 0.265 | 0.313 | 0.251 |
| 15.04.2024 | 0.237 | 0.251 | 0.223 |
| 14.04.2024 | 0.236 | 0.251 | 0.223 |
| 13.04.2024 | 0.251 | 0.251 | 0.251 |
| 12.04.2024 | 0.251 | 0.251 | 0.251 |
© Bayerisches Landesamt für Umwelt 2024