
- Start >
- Rivers >
- Discharge >
- Isar >
- Obermühlhausen >
- Chart of total period

Chart of total period Obermühlhausen / Beurerbach
Discharge from 01.11.1985 to 20.04.2024
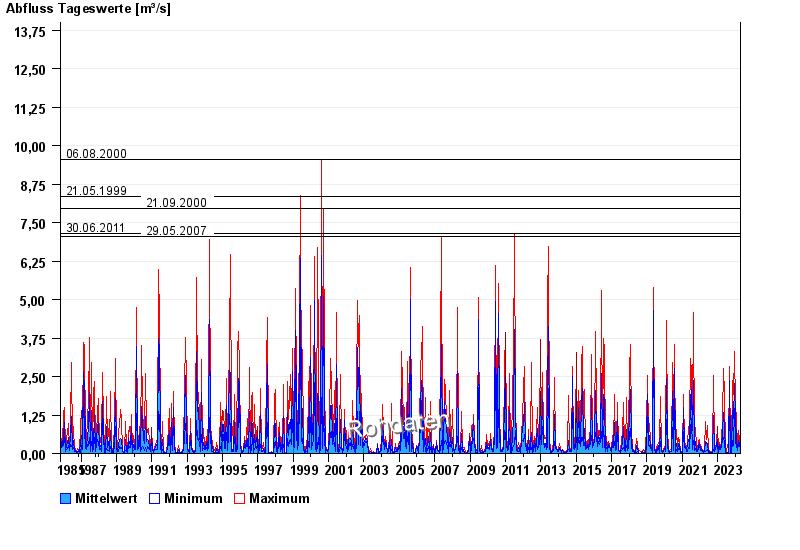
- 06.08.2000 Abfluss: 9,54 m³/s
- 21.05.1999 Abfluss: 8,36 m³/s
- 21.09.2000 Abfluss: 7,97 m³/s
- 30.06.2011 Abfluss: 7,15 m³/s
- 29.05.2007 Abfluss: 7,05 m³/s
| Date | Mean value [m³/s] | Maximum [m³/s] | Minimum [m³/s] |
|---|---|---|---|
| 20.04.2024 | 0.132 | 0.132 | 0.132 |
| 19.04.2024 | 0.13 | 0.172 | 0.114 |
| 18.04.2024 | 0.11 | 0.172 | 0.081 |
| 17.04.2024 | 0.061 | 0.097 | 0.041 |
| 16.04.2024 | 0.045 | 0.054 | 0.041 |
| 15.04.2024 | 0.043 | 0.081 | 0.021 |
| 14.04.2024 | 0.022 | 0.031 | 0.021 |
© Bayerisches Landesamt für Umwelt 2024