
- Start >
- Rivers >
- Discharge >
- Isar >
- Obermühlhausen >
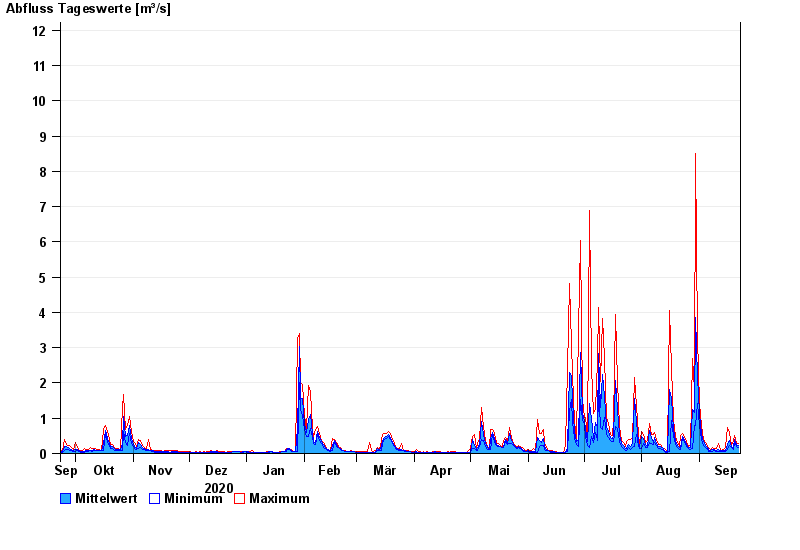
- Chart of year

Chart of year Obermühlhausen / Windach
Discharge from 23.09.2020 to 22.09.2021
- 21.05.1999 Abfluss: 25,6 m³/s
- 06.08.2000 Abfluss: 21,3 m³/s
- 02.06.2013 Abfluss: 18,8 m³/s
- 18.06.1979 Abfluss: 18,7 m³/s
- 13.04.1994 Abfluss: 16,3 m³/s
| Date | Mean value [m³/s] | Maximum [m³/s] | Minimum [m³/s] |
|---|---|---|---|
| 22.09.2021 | 0.222 | 0.279 | 0.169 |
| 21.09.2021 | 0.262 | 0.319 | 0.203 |
| 20.09.2021 | 0.403 | 0.5 | 0.319 |
| 19.09.2021 | 0.176 | 0.361 | 0.109 |
| 18.09.2021 | 0.205 | 0.238 | 0.168 |
| 17.09.2021 | 0.359 | 0.595 | 0.238 |
| 16.09.2021 | 0.268 | 0.75 | 0.108 |
© Bayerisches Landesamt für Umwelt 2024