
- Start >
- Rivers >
- Discharge >
- Isar >
- Obermühlhausen >
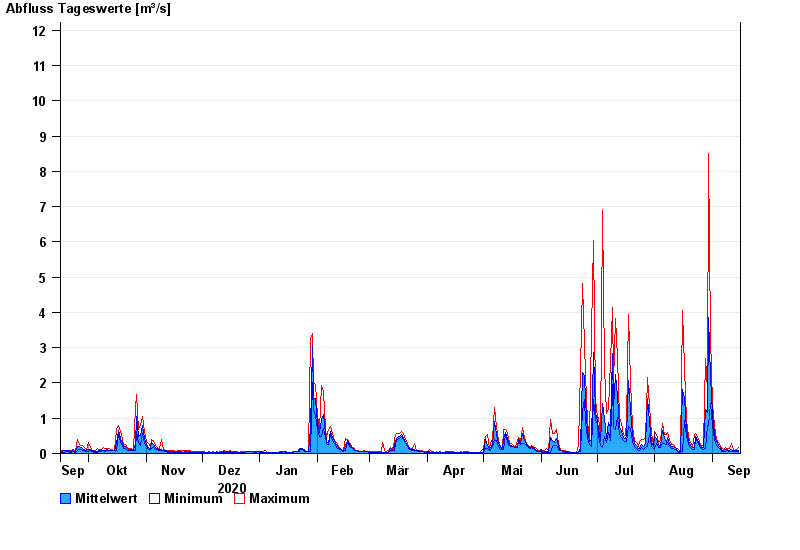
- Chart of year

Chart of year Obermühlhausen / Windach
Discharge from 16.09.2020 to 15.09.2021
- 21.05.1999 Abfluss: 25,6 m³/s
- 06.08.2000 Abfluss: 21,3 m³/s
- 02.06.2013 Abfluss: 18,8 m³/s
- 18.06.1979 Abfluss: 18,7 m³/s
- 13.04.1994 Abfluss: 16,3 m³/s
| Date | Mean value [m³/s] | Maximum [m³/s] | Minimum [m³/s] |
|---|---|---|---|
| 15.09.2021 | 0.096 | 0.167 | 0.045 |
| 14.09.2021 | 0.074 | 0.108 | 0.063 |
| 13.09.2021 | 0.072 | 0.083 | 0.045 |
| 12.09.2021 | 0.08 | 0.107 | 0.062 |
| 11.09.2021 | 0.112 | 0.273 | 0.062 |
| 10.09.2021 | 0.091 | 0.134 | 0.062 |
| 09.09.2021 | 0.109 | 0.134 | 0.082 |
© Bayerisches Landesamt für Umwelt 2024