
- Start >
- Rivers >
- Discharge >
- Isar >
- Obermühlhausen >
- Chart of year

Chart of year Obermühlhausen / Windach
Discharge from 24.09.2019 to 23.09.2020
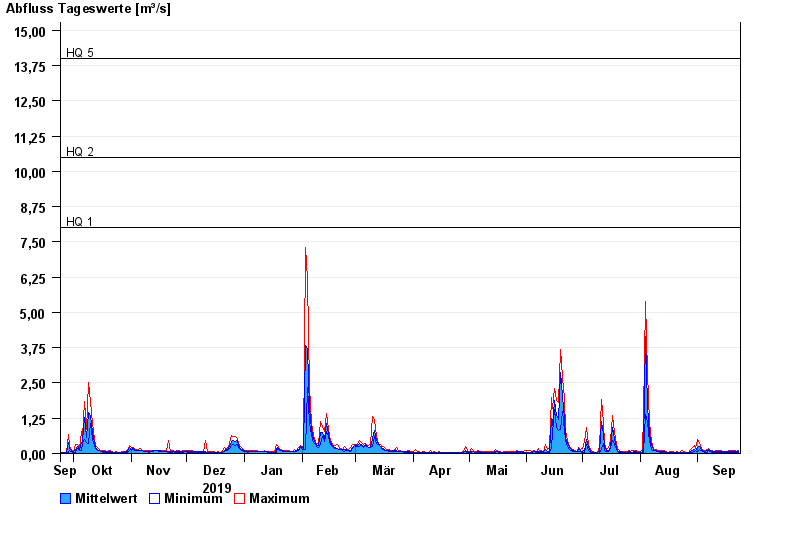
- HQ1 8 m³/s
- HQ2 10,5 m³/s
- HQ5 14 m³/s
- HQ10 17 m³/s
- HQ20 20 m³/s
- HQ50 24 m³/s
- HQ100 27 m³/s
| Date | Mean value [m³/s] | Maximum [m³/s] | Minimum [m³/s] |
|---|---|---|---|
| 23.09.2020 | 0.072 | 0.121 | 0.051 |
| 22.09.2020 | 0.06 | 0.071 | 0.036 |
| 21.09.2020 | 0.059 | 0.094 | 0.036 |
| 20.09.2020 | 0.078 | 0.094 | 0.051 |
| 19.09.2020 | 0.081 | 0.094 | 0.051 |
| 18.09.2020 | 0.071 | 0.094 | 0.025 |
| 17.09.2020 | 0.056 | 0.071 | 0.036 |
© Bayerisches Landesamt für Umwelt 2024