
- Start >
- Rivers >
- Discharge >
- Isar >
- Obermühlhausen >
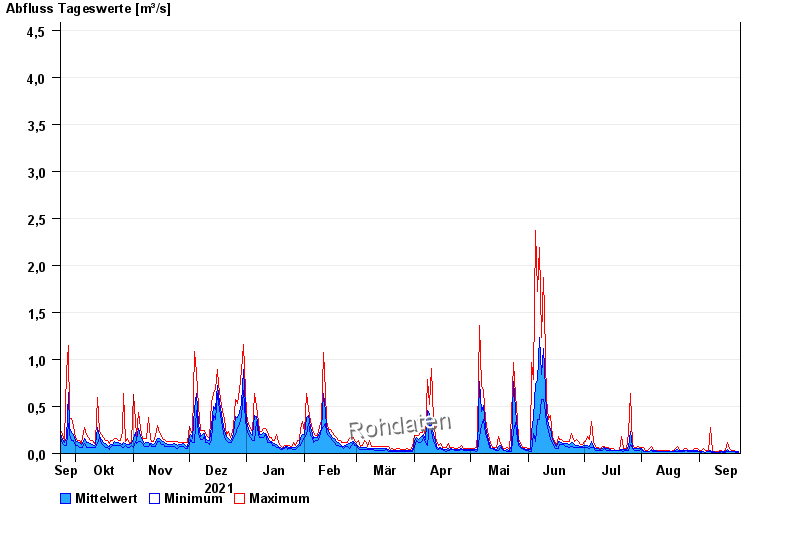
- Chart of year

Chart of year Obermühlhausen / Windach
Discharge from 23.09.2021 to 22.09.2022
- HQ1 8 m³/s
- HQ2 10,5 m³/s
- HQ5 14 m³/s
- HQ10 17 m³/s
- HQ20 20 m³/s
- HQ50 24 m³/s
- HQ100 27 m³/s
| Date | Mean value [m³/s] | Maximum [m³/s] | Minimum [m³/s] |
|---|---|---|---|
| 22.09.2022 | 0.016 | 0.022 | 0.01 |
| 21.09.2022 | 0.017 | 0.022 | 0.013 |
| 20.09.2022 | 0.022 | 0.029 | 0.016 |
| 19.09.2022 | 0.024 | 0.029 | 0.016 |
| 18.09.2022 | 0.022 | 0.029 | 0.016 |
| 17.09.2022 | 0.022 | 0.049 | 0.016 |
| 16.09.2022 | 0.041 | 0.12 | 0.016 |
© Bayerisches Landesamt für Umwelt 2024