
- Start >
- Rivers >
- Discharge >
- Isar >
- Oberhausen >
- Chart of year

Chart of year Oberhausen / Ach
Discharge from 01.01.2020 to 31.12.2020
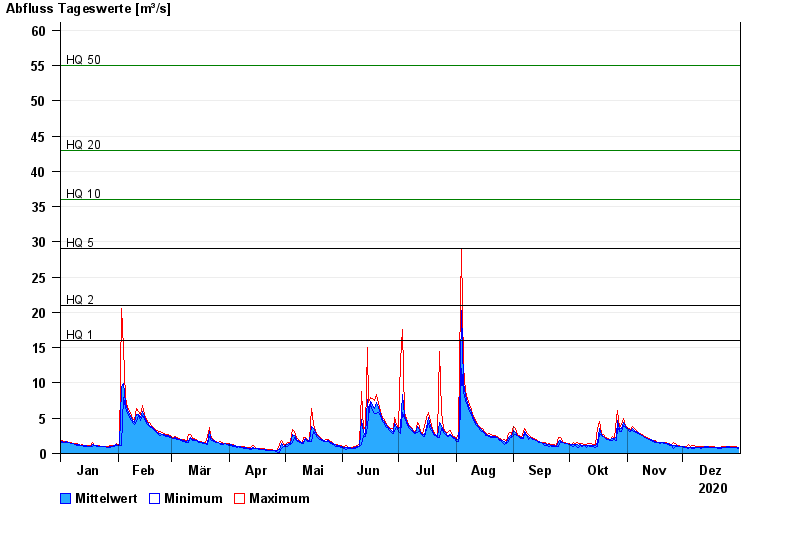
- HQ1 16 m³/s
- HQ2 21 m³/s
- HQ5 29 m³/s
- HQ10 36 m³/s
- HQ20 43 m³/s
- HQ50 55 m³/s
- HQ100 63 m³/s
| Date | Mean value [m³/s] | Maximum [m³/s] | Minimum [m³/s] |
|---|---|---|---|
| 31.12.2020 | 0.837 | 0.905 | 0.754 |
| 30.12.2020 | 0.873 | 0.985 | 0.825 |
| 29.12.2020 | 0.889 | 0.983 | 0.824 |
| 28.12.2020 | 0.892 | 0.982 | 0.821 |
| 27.12.2020 | 0.905 | 0.98 | 0.82 |
| 26.12.2020 | 0.948 | 0.978 | 0.895 |
| 25.12.2020 | 0.923 | 0.976 | 0.893 |
© Bayerisches Landesamt für Umwelt 2024