

Chart of total period Oberding / Gfällach
Discharge from 01.11.1973 to 19.04.2024
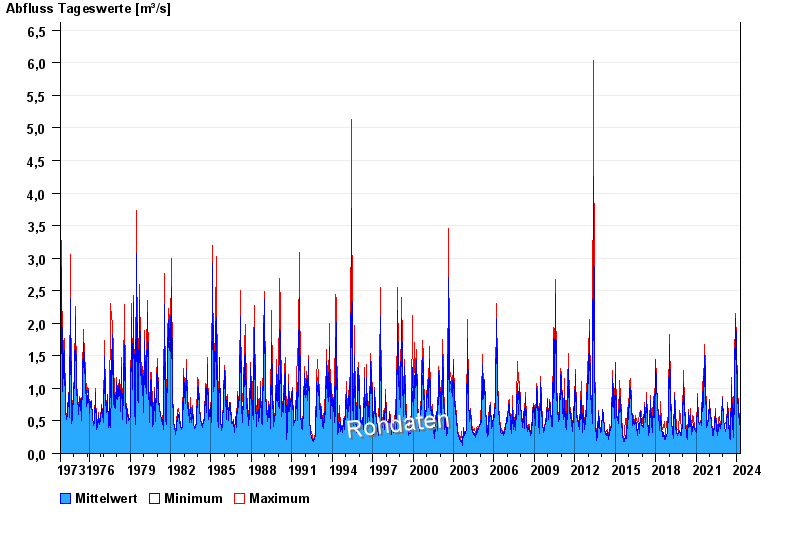
| Date | Mean value [m³/s] | Maximum [m³/s] | Minimum [m³/s] |
|---|---|---|---|
| 19.04.2024 | 0.469 | 0.469 | 0.469 |
| 18.04.2024 | 0.448 | 0.469 | 0.439 |
| 17.04.2024 | 0.418 | 0.5 | 0.356 |
| 16.04.2024 | 0.381 | 0.383 | 0.356 |
| 15.04.2024 | 0.376 | 0.411 | 0.356 |
| 14.04.2024 | 0.356 | 0.356 | 0.356 |
| 13.04.2024 | 0.356 | 0.356 | 0.356 |
© Bayerisches Landesamt für Umwelt 2024