

Chart of total period Oberding / Gfällach
Discharge from 01.11.1973 to 16.04.2024
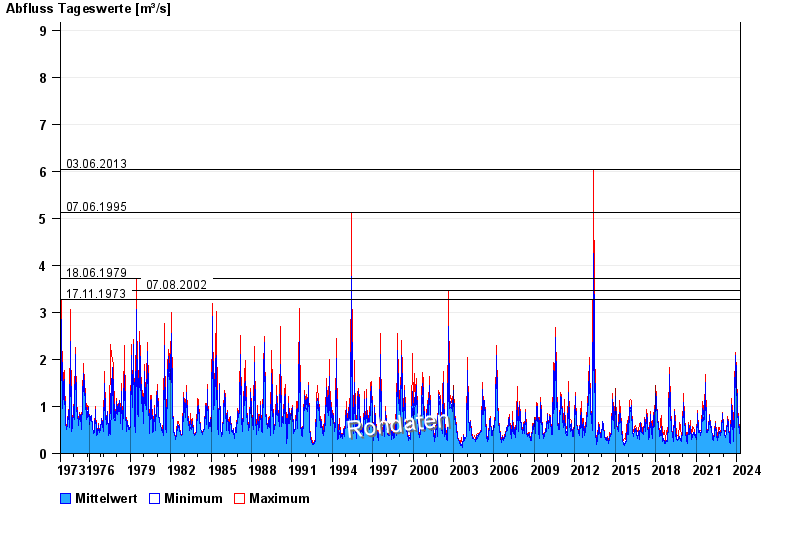
- 03.06.2013 Abfluss: 6,03 m³/s
- 07.06.1995 Abfluss: 5,13 m³/s
- 18.06.1979 Abfluss: 3,73 m³/s
- 07.08.2002 Abfluss: 3,46 m³/s
- 17.11.1973 Abfluss: 3,27 m³/s
| Date | Mean value [m³/s] | Maximum [m³/s] | Minimum [m³/s] |
|---|---|---|---|
| 16.04.2024 | 0.383 | 0.383 | 0.383 |
| 15.04.2024 | 0.376 | 0.411 | 0.356 |
| 14.04.2024 | 0.356 | 0.356 | 0.356 |
| 13.04.2024 | 0.356 | 0.356 | 0.356 |
| 12.04.2024 | 0.356 | 0.356 | 0.356 |
| 11.04.2024 | 0.356 | 0.356 | 0.356 |
| 10.04.2024 | 0.356 | 0.356 | 0.356 |
© Bayerisches Landesamt für Umwelt 2024