
- Start >
- Rivers >
- Discharge >
- Isar >
- Oberammergau >
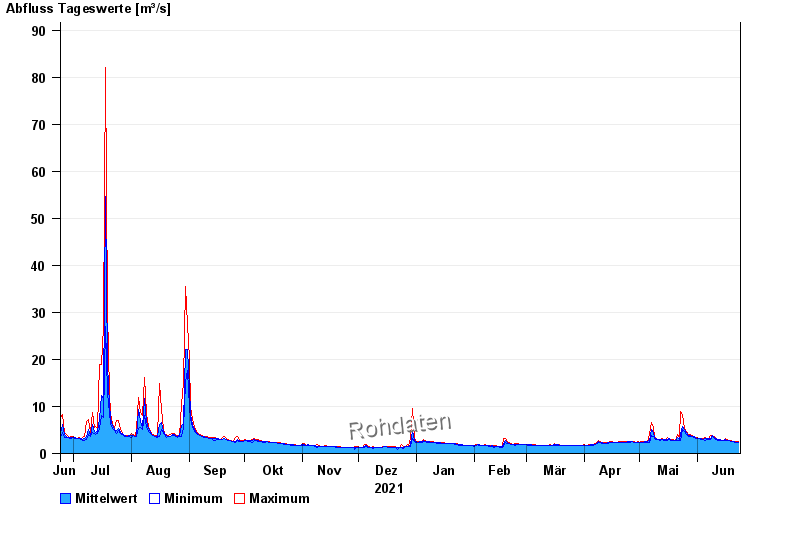
- Chart of year

Chart of year Oberammergau / Ammer
Discharge from 24.06.2021 to 23.06.2022
| Date | Mean value [m³/s] | Maximum [m³/s] | Minimum [m³/s] |
|---|---|---|---|
| 23.06.2022 | 2.37 | 2.51 | 2.35 |
| 22.06.2022 | 2.36 | 2.51 | 2.35 |
| 21.06.2022 | 2.47 | 2.51 | 2.35 |
| 20.06.2022 | 2.51 | 2.51 | 2.51 |
| 19.06.2022 | 2.53 | 2.68 | 2.51 |
| 18.06.2022 | 2.68 | 2.68 | 2.68 |
| 17.06.2022 | 2.83 | 3.05 | 2.68 |
© Bayerisches Landesamt für Umwelt 2024