
- Start >
- Rivers >
- Discharge >
- Isar >
- Oberammergau >
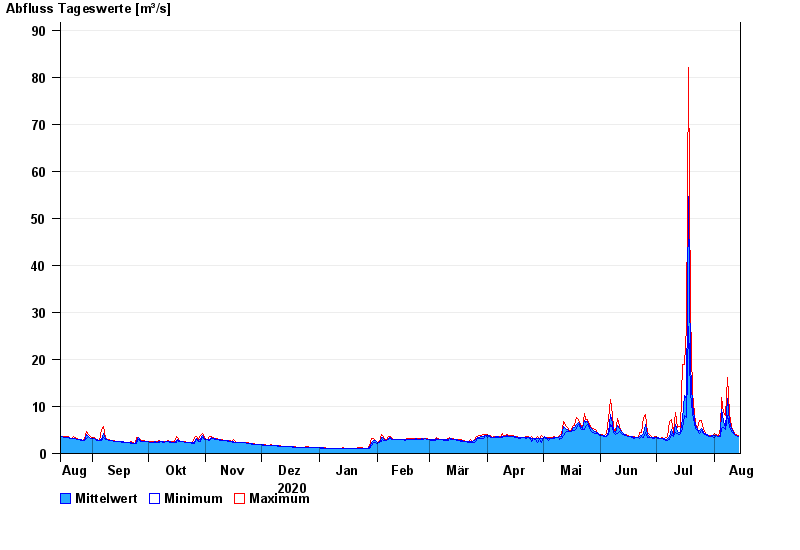
- Chart of year

Chart of year Oberammergau / Ammer
Discharge from 15.08.2020 to 14.08.2021
| Date | Mean value [m³/s] | Maximum [m³/s] | Minimum [m³/s] |
|---|---|---|---|
| 14.08.2021 | 3.66 | 3.82 | 3.6 |
| 13.08.2021 | 3.86 | 4.04 | 3.82 |
| 12.08.2021 | 4.14 | 4.28 | 4.04 |
| 11.08.2021 | 4.54 | 4.76 | 4.28 |
| 10.08.2021 | 5.25 | 5.82 | 4.76 |
| 09.08.2021 | 6.83 | 8.43 | 5.82 |
| 08.08.2021 | 11.8 | 16.2 | 8.14 |
© Bayerisches Landesamt für Umwelt 2024