
- Start >
- Rivers >
- Discharge >
- Isar >
- Oberammergau >
- Chart of year

Chart of year Oberammergau / Ammer
Discharge from 06.12.2020 to 05.12.2021
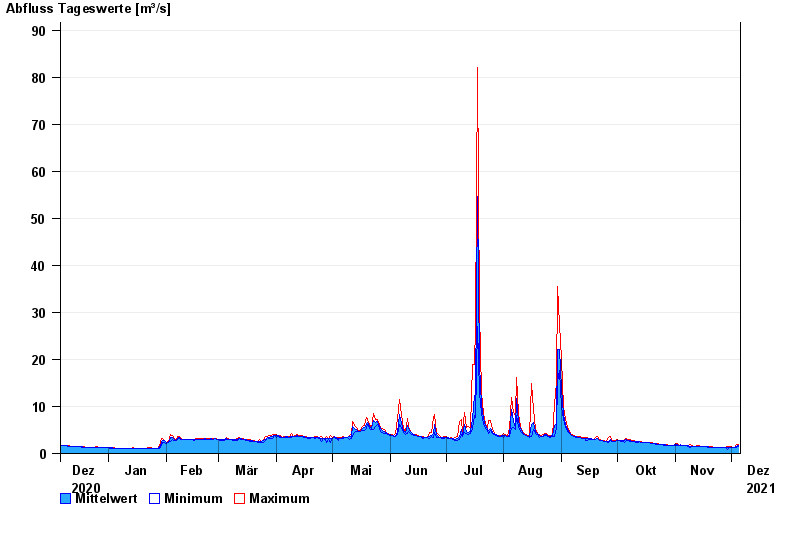
| Date | Mean value [m³/s] | Maximum [m³/s] | Minimum [m³/s] |
|---|---|---|---|
| 05.12.2021 | 1.65 | 1.95 | 1.41 |
| 04.12.2021 | 1.47 | 1.95 | 1.19 |
| 03.12.2021 | 1.24 | 1.29 | 1.19 |
| 02.12.2021 | 1.29 | 1.29 | 1.29 |
| 01.12.2021 | 1.33 | 1.53 | 1.29 |
| 30.11.2021 | 1.23 | 1.53 | 1.19 |
| 29.11.2021 | 1.19 | 1.53 | 0.914 |
© Bayerisches Landesamt für Umwelt 2024