
- Start >
- Rivers >
- Discharge >
- Isar >
- Oberammergau >
- Chart of year

Chart of year Oberammergau / Ammer
Discharge from 23.05.2022 to 22.05.2023
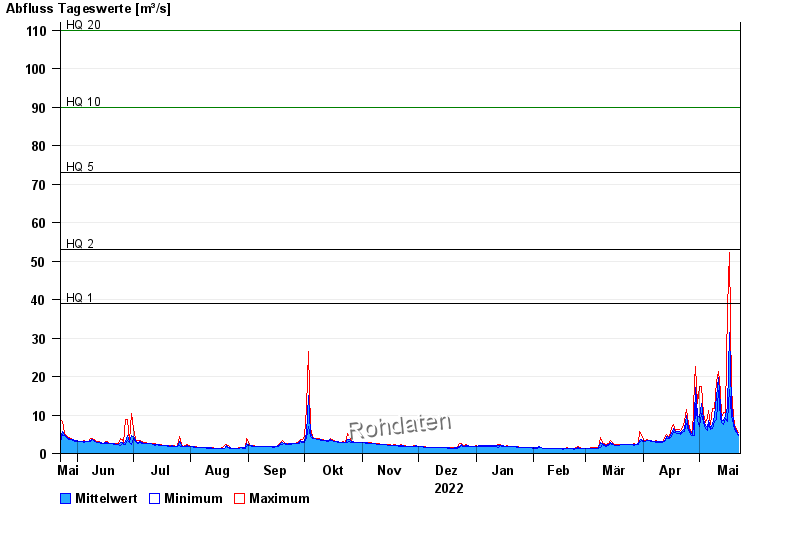
- HQ1 39 m³/s
- HQ2 53 m³/s
- HQ5 73 m³/s
- HQ10 90 m³/s
- HQ20 110 m³/s
- HQ50 135 m³/s
- HQ100 160 m³/s
| Date | Mean value [m³/s] | Maximum [m³/s] | Minimum [m³/s] |
|---|---|---|---|
| 22.05.2023 | 4.95 | 5.34 | 4.58 |
| 21.05.2023 | 5.7 | 6.17 | 5.34 |
| 20.05.2023 | 6.73 | 7.63 | 6.17 |
| 19.05.2023 | 8.55 | 10 | 7.63 |
| 18.05.2023 | 12.6 | 16.6 | 10 |
| 17.05.2023 | 31.5 | 52.2 | 16.6 |
| 16.05.2023 | 12.3 | 37.6 | 8.23 |
© Bayerisches Landesamt für Umwelt 2024