
- Start >
- Rivers >
- Discharge >
- Isar >
- Oberammergau >
- Chart of year

Chart of year Oberammergau / Ammer
Discharge from 01.01.2024 to 19.04.2024
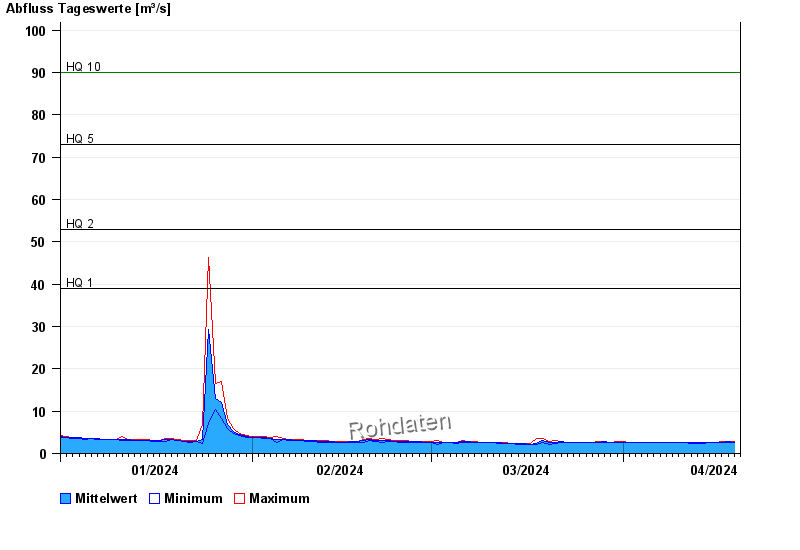
- HQ1 39 m³/s
- HQ2 53 m³/s
- HQ5 73 m³/s
- HQ10 90 m³/s
- HQ20 110 m³/s
- HQ50 135 m³/s
- HQ100 160 m³/s
| Date | Mean value [m³/s] | Maximum [m³/s] | Minimum [m³/s] |
|---|---|---|---|
| 19.04.2024 | 2.69 | 2.87 | 2.68 |
| 18.04.2024 | 2.76 | 2.87 | 2.68 |
| 17.04.2024 | 2.67 | 2.87 | 2.51 |
| 16.04.2024 | 2.56 | 2.68 | 2.51 |
| 15.04.2024 | 2.56 | 2.68 | 2.51 |
| 14.04.2024 | 2.51 | 2.68 | 2.34 |
| 13.04.2024 | 2.5 | 2.51 | 2.34 |
© Bayerisches Landesamt für Umwelt 2024