

Chart of total period Oberach / Weißach
Discharge from 01.11.1957 to 24.04.2024
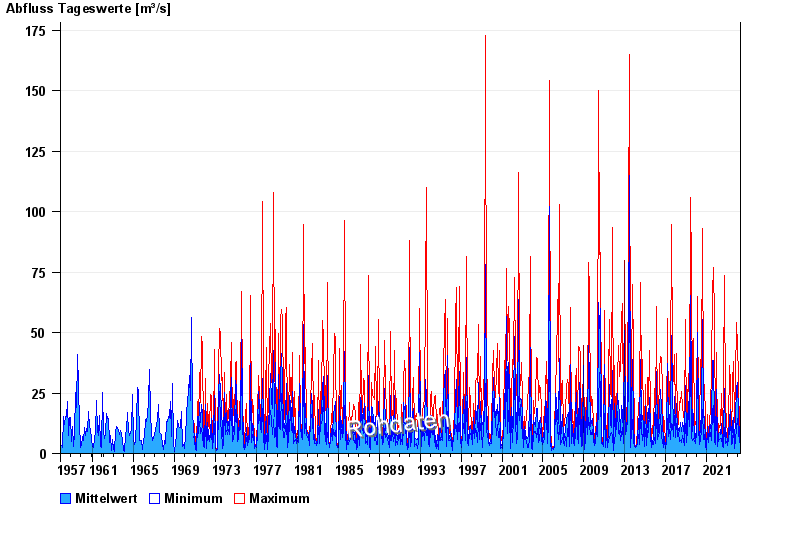
| Date | Mean value [m³/s] | Maximum [m³/s] | Minimum [m³/s] |
|---|---|---|---|
| 24.04.2024 | 3.55 | 3.55 | 3.55 |
| 23.04.2024 | 3.78 | 3.97 | 3.55 |
| 22.04.2024 | 4.17 | 4.67 | 3.97 |
| 21.04.2024 | 4.42 | 4.67 | 4.2 |
| 20.04.2024 | 5.21 | 5.96 | 4.67 |
| 19.04.2024 | 3.55 | 5.16 | 3.15 |
| 18.04.2024 | 3.09 | 3.35 | 2.97 |
© Bayerisches Landesamt für Umwelt 2024