

Chart of year Mühltal / Glonn
Discharge from 19.08.2019 to 18.08.2020
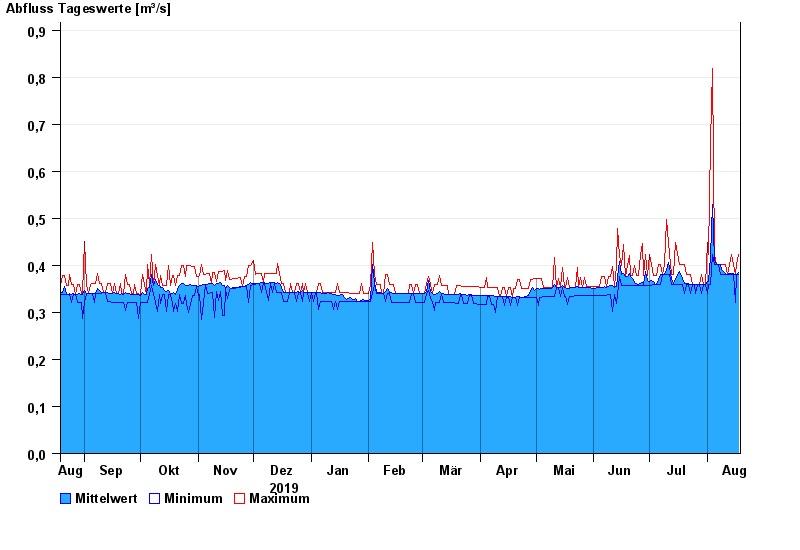
| Date | Mean value [m³/s] | Maximum [m³/s] | Minimum [m³/s] |
|---|---|---|---|
| 18.08.2020 | 0.385 | 0.424 | 0.38 |
| 17.08.2020 | 0.381 | 0.402 | 0.38 |
| 16.08.2020 | 0.38 | 0.38 | 0.322 |
| 15.08.2020 | 0.382 | 0.402 | 0.38 |
| 14.08.2020 | 0.383 | 0.424 | 0.38 |
| 13.08.2020 | 0.382 | 0.402 | 0.38 |
| 12.08.2020 | 0.38 | 0.38 | 0.38 |
© Bayerisches Landesamt für Umwelt 2024