

Chart of year Mühltal / Glonn
Discharge from 15.08.2021 to 14.08.2022
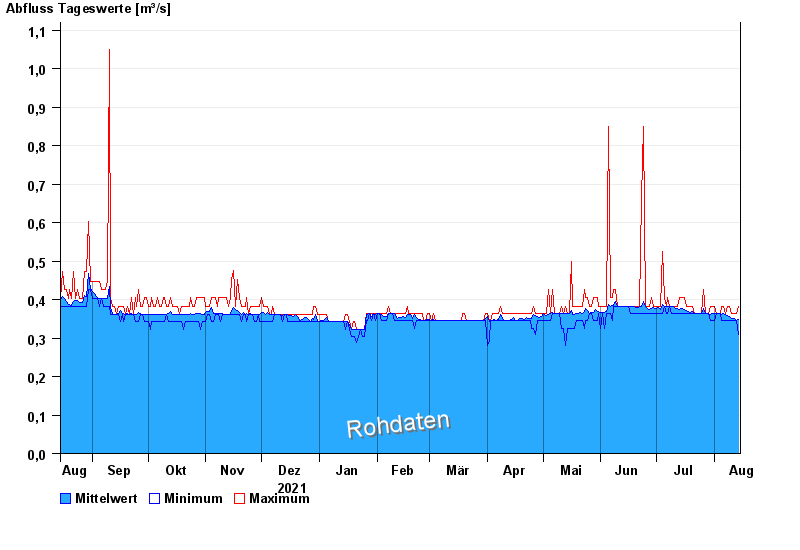
| Date | Mean value [m³/s] | Maximum [m³/s] | Minimum [m³/s] |
|---|---|---|---|
| 14.08.2022 | 0.348 | 0.383 | 0.31 |
| 13.08.2022 | 0.346 | 0.363 | 0.345 |
| 12.08.2022 | 0.35 | 0.363 | 0.345 |
| 11.08.2022 | 0.352 | 0.363 | 0.345 |
| 10.08.2022 | 0.352 | 0.363 | 0.345 |
| 09.08.2022 | 0.355 | 0.383 | 0.345 |
| 08.08.2022 | 0.359 | 0.383 | 0.345 |
© Bayerisches Landesamt für Umwelt 2024