

Chart of year Mühlried / Paar
Discharge from 01.01.2024 to 23.04.2024
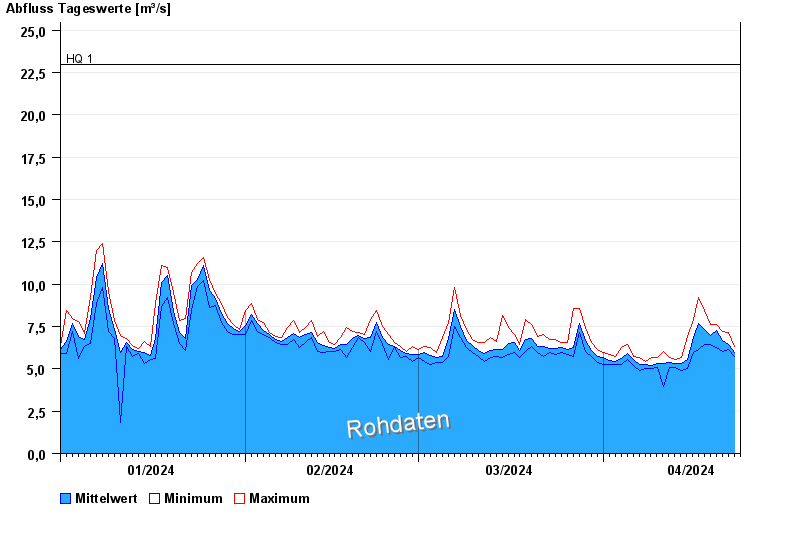
note
Geber 2 Defekt
- HQ1 23 m³/s
- HQ2 29 m³/s
- HQ5 37 m³/s
- HQ10 44 m³/s
- HQ20 51 m³/s
- HQ50 63 m³/s
- HQ100 72,3 m³/s
| Date | Mean value [m³/s] | Maximum [m³/s] | Minimum [m³/s] |
|---|---|---|---|
| 23.04.2024 | 6 | 6.33 | 5.75 |
| 22.04.2024 | 6.45 | 7.13 | 6.14 |
| 21.04.2024 | 6.69 | 7.23 | 6.04 |
| 20.04.2024 | 7.29 | 7.63 | 6.24 |
| 19.04.2024 | 6.99 | 7.63 | 6.44 |
| 18.04.2024 | 7.32 | 8.45 | 6.44 |
| 17.04.2024 | 7.69 | 9.23 | 6.14 |
© Bayerisches Landesamt für Umwelt 2024