

Chart of total period Mühlried / Paar
Discharge from 01.11.1950 to 19.04.2024
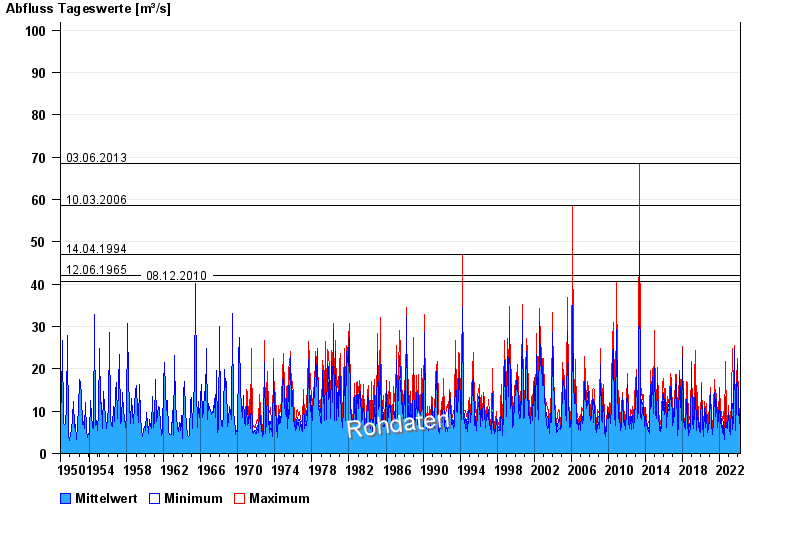
note
Geber 2 Defekt
- 03.06.2013 Abfluss: 68,4 m³/s
- 10.03.2006 Abfluss: 58,5 m³/s
- 14.04.1994 Abfluss: 47 m³/s
- 12.06.1965 Abfluss: 42 m³/s
- 08.12.2010 Abfluss: 40,7 m³/s
| Date | Mean value [m³/s] | Maximum [m³/s] | Minimum [m³/s] |
|---|---|---|---|
| 19.04.2024 | 6.89 | 7.23 | 6.54 |
| 18.04.2024 | 7.32 | 8.45 | 6.44 |
| 17.04.2024 | 7.69 | 9.23 | 6.14 |
| 16.04.2024 | 6.83 | 7.93 | 5.94 |
| 15.04.2024 | 5.58 | 6.93 | 5 |
| 14.04.2024 | 5.3 | 5.66 | 4.91 |
| 13.04.2024 | 5.33 | 5.56 | 5.09 |
© Bayerisches Landesamt für Umwelt 2024