
- Start >
- Rivers >
- Discharge >
- Isar >
- Mittenwald >
- Chart of year

Chart of year Mittenwald / Leutasch
Discharge from 01.01.2024 to 19.04.2024
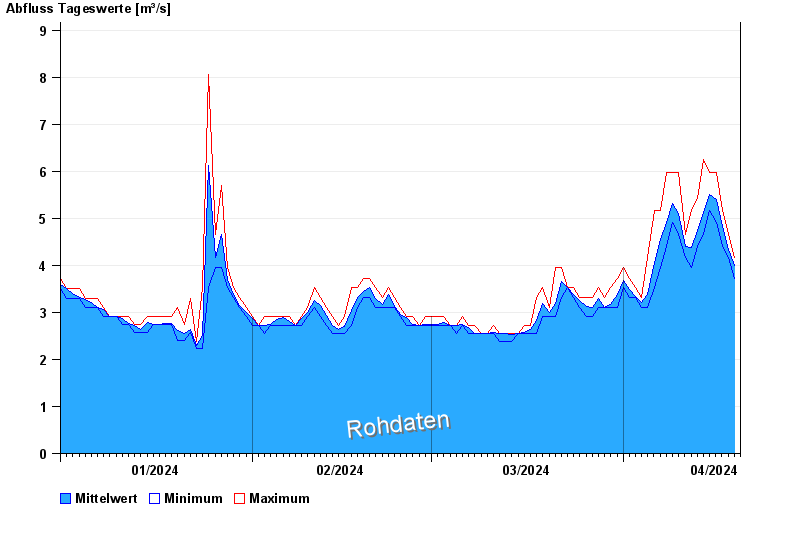
| Date | Mean value [m³/s] | Maximum [m³/s] | Minimum [m³/s] |
|---|---|---|---|
| 19.04.2024 | 4 | 4.17 | 3.73 |
| 18.04.2024 | 4.33 | 4.66 | 4.17 |
| 17.04.2024 | 4.83 | 5.17 | 4.41 |
| 16.04.2024 | 5.39 | 5.97 | 4.91 |
| 15.04.2024 | 5.51 | 5.97 | 5.17 |
| 14.04.2024 | 5.13 | 6.25 | 4.66 |
| 13.04.2024 | 4.74 | 5.43 | 4.41 |
© Bayerisches Landesamt für Umwelt 2024