
- Start >
- Rivers >
- Discharge >
- Isar >
- Mittenwald >
- Chart of total period

Chart of total period Mittenwald / Leutasch
Discharge from 01.11.1927 to 25.04.2024
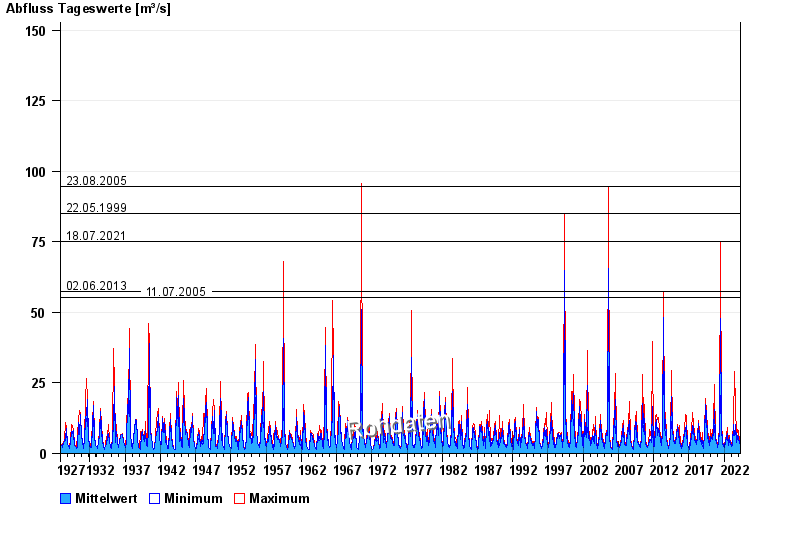
- 23.08.2005 Abfluss: 94,6 m³/s
- 22.05.1999 Abfluss: 85 m³/s
- 18.07.2021 Abfluss: 75,3 m³/s
- 02.06.2013 Abfluss: 57,4 m³/s
- 11.07.2005 Abfluss: 55,4 m³/s
| Date | Mean value [m³/s] | Maximum [m³/s] | Minimum [m³/s] |
|---|---|---|---|
| 25.04.2024 | 3.11 | 3.31 | 3.11 |
| 24.04.2024 | 3.23 | 3.31 | 3.11 |
| 23.04.2024 | 3.31 | 3.52 | 3.11 |
| 22.04.2024 | 3.5 | 3.52 | 3.31 |
| 21.04.2024 | 3.69 | 3.73 | 3.52 |
| 20.04.2024 | 3.84 | 3.95 | 3.73 |
| 19.04.2024 | 4 | 4.17 | 3.73 |
© Bayerisches Landesamt für Umwelt 2024