
- Start >
- Rivers >
- Discharge >
- Isar >
- Mittenwald >
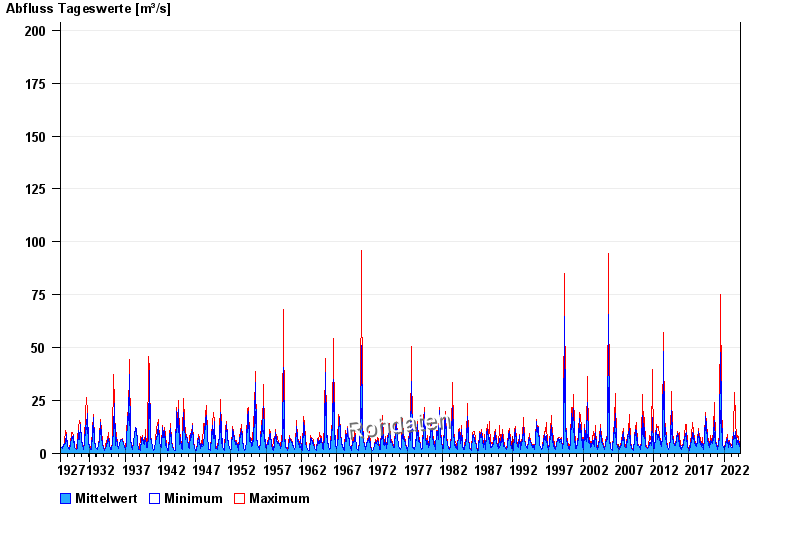
- Chart of total period

Chart of total period Mittenwald / Leutasch
Discharge from 01.11.1927 to 23.04.2024
 Für diesen Pegel sind keine Jährlichkeiten hinterlegt.
| Date | Mean value [m³/s] | Maximum [m³/s] | Minimum [m³/s] |
|---|---|---|---|
| 23.04.2024 | 3.31 | 3.52 | 3.11 |
| 22.04.2024 | 3.5 | 3.52 | 3.31 |
| 21.04.2024 | 3.69 | 3.73 | 3.52 |
| 20.04.2024 | 3.84 | 3.95 | 3.73 |
| 19.04.2024 | 4 | 4.17 | 3.73 |
| 18.04.2024 | 4.33 | 4.66 | 4.17 |
| 17.04.2024 | 4.83 | 5.17 | 4.41 |
© Bayerisches Landesamt für Umwelt 2024