
- Start >
- Rivers >
- Discharge >
- Isar >
- Manching (Ort) >
- Chart of year

Chart of year Manching (Ort) / Paar
Discharge from 01.01.2024 to 19.04.2024
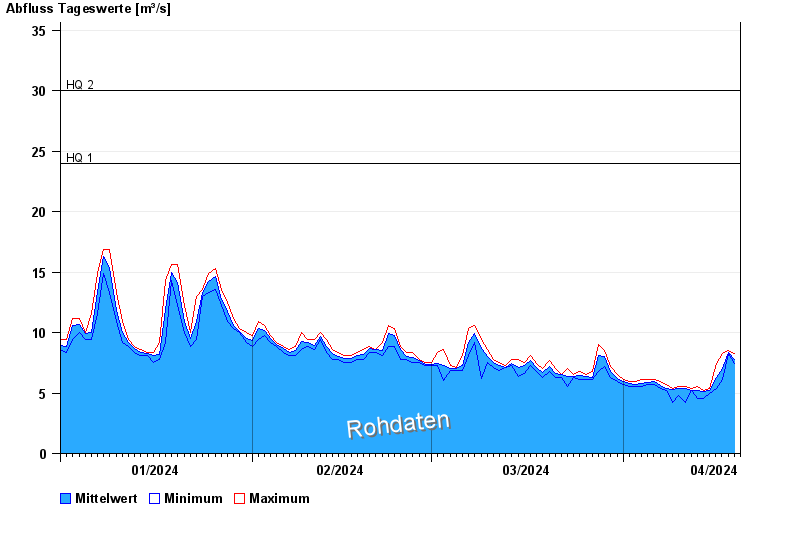
- HQ1 24 m³/s
- HQ2 30 m³/s
- HQ5 40 m³/s
- HQ10 49 m³/s
- HQ20 60 m³/s
- HQ50 77 m³/s
- HQ100 92 m³/s
| Date | Mean value [m³/s] | Maximum [m³/s] | Minimum [m³/s] |
|---|---|---|---|
| 19.04.2024 | 7.81 | 8.24 | 7.46 |
| 18.04.2024 | 8.34 | 8.51 | 8.24 |
| 17.04.2024 | 7.04 | 8.24 | 6.12 |
| 16.04.2024 | 6.25 | 7.46 | 5.35 |
| 15.04.2024 | 5.22 | 5.35 | 4.99 |
| 14.04.2024 | 5.15 | 5.17 | 4.52 |
| 13.04.2024 | 5.17 | 5.54 | 4.52 |
© Bayerisches Landesamt für Umwelt 2024