

Chart of total period Mainburg / Abens
Discharge from 01.11.1967 to 19.04.2024
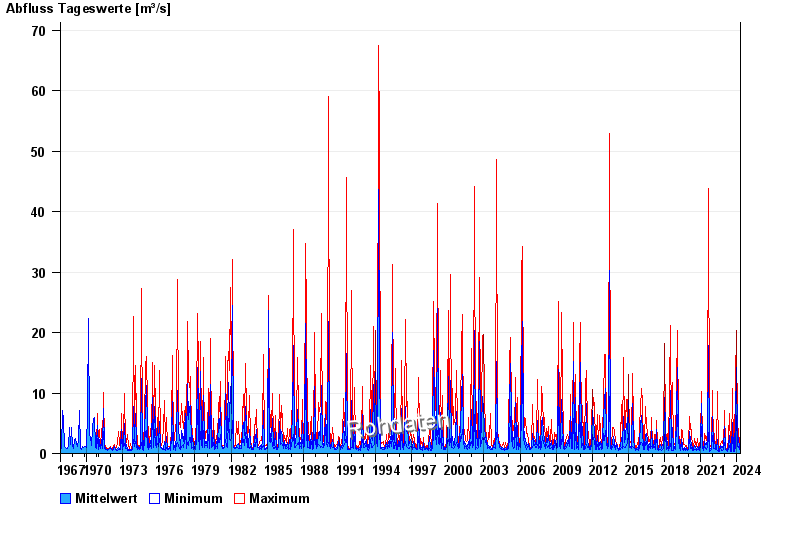
| Date | Mean value [m³/s] | Maximum [m³/s] | Minimum [m³/s] |
|---|---|---|---|
| 19.04.2024 | 0.616 | 0.69 | 0.553 |
| 18.04.2024 | 0.919 | 1.39 | 0.69 |
| 17.04.2024 | 0.664 | 0.904 | 0.553 |
| 16.04.2024 | 0.585 | 0.74 | 0.512 |
| 15.04.2024 | 0.606 | 0.904 | 0.473 |
| 14.04.2024 | 0.493 | 0.553 | 0.473 |
| 13.04.2024 | 0.501 | 0.553 | 0.473 |
© Bayerisches Landesamt für Umwelt 2024