
- Start >
- Rivers >
- Discharge >
- Isar >
- Leutstetten >
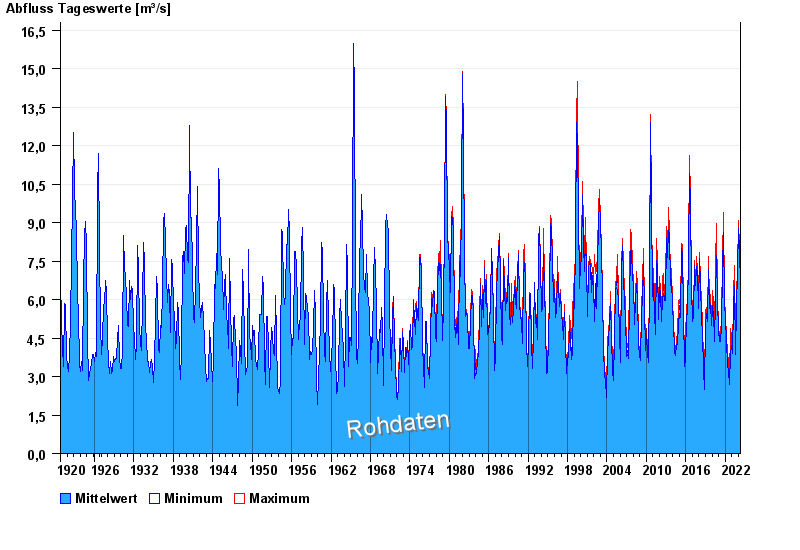
- Chart of total period

Chart of total period Leutstetten / Würm
Discharge from 01.11.1920 to 25.04.2024
| Date | Mean value [m³/s] | Maximum [m³/s] | Minimum [m³/s] |
|---|---|---|---|
| 25.04.2024 | 5.5 | 5.61 | 5.38 |
| 24.04.2024 | 5.51 | 5.61 | 5.5 |
| 23.04.2024 | 5.5 | 5.73 | 5.38 |
| 22.04.2024 | 5.58 | 5.73 | 5.38 |
| 21.04.2024 | 5.64 | 5.84 | 5.38 |
| 20.04.2024 | 5.65 | 5.84 | 5.5 |
| 19.04.2024 | 5.66 | 5.84 | 5.5 |
© Bayerisches Landesamt für Umwelt 2024